Fig. 5
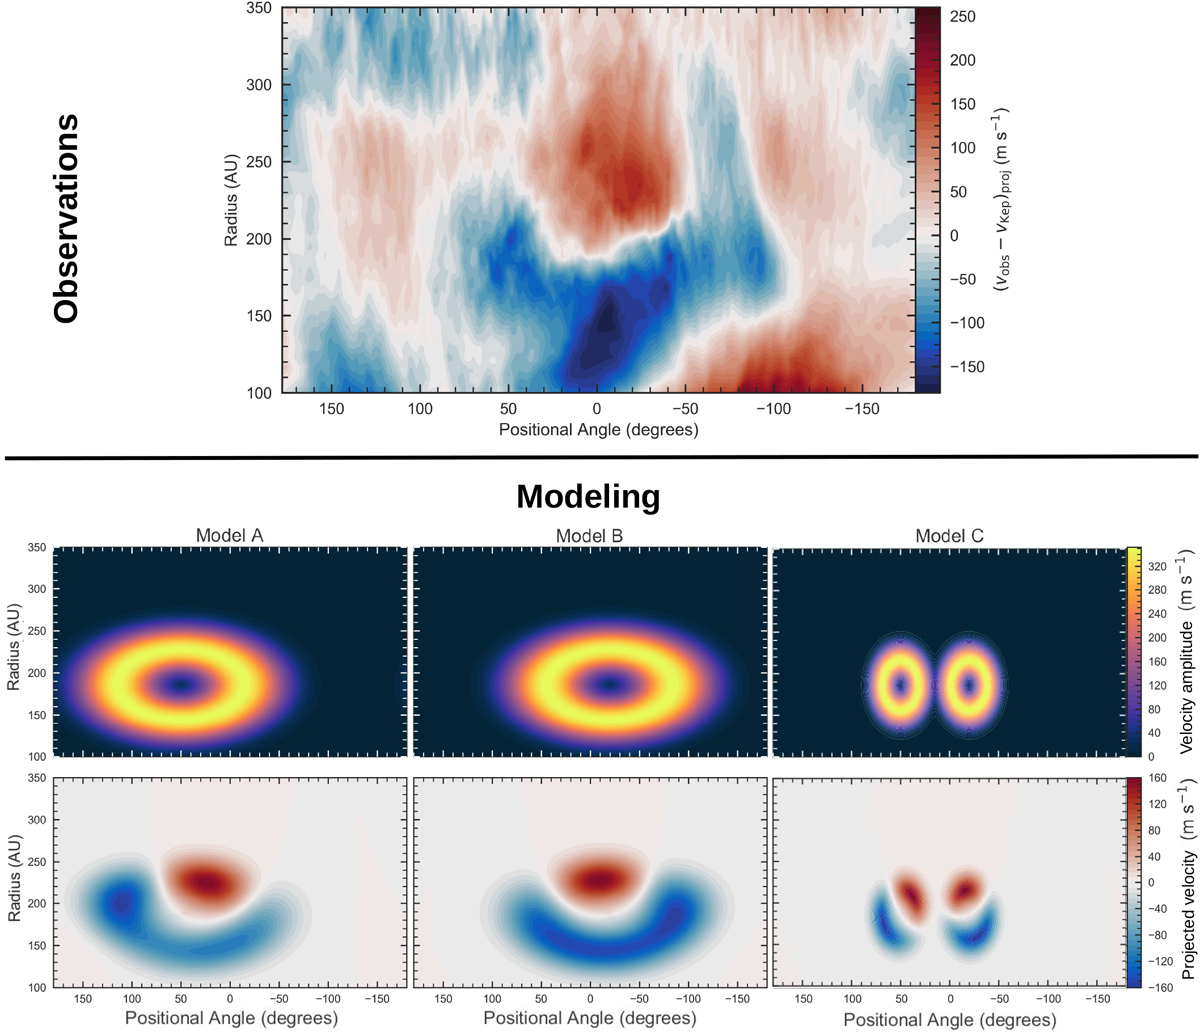
Comparison of the velocity deviations measured in the HD 142527 system with vortex models. Top: Difference between the 13CO J = 3–2 velocity measured from our observations and the Keplerian prescription in a 2D-map (R, θ). Blue and red colors indicate blue- and redshifted velocities along the line-of-sight compared to the Keplerian rotation. θ = 0° represents the north of the major axis. Bottom: Three vortex prescriptions with their corresponding velocity amplitude in the planeof the disk (top), rotating clockwise around the vortex center on elliptical streamlines, and the projected velocity along the line-of-sight (bottom). Model A corresponds to a large vortex centered at the position of the continuum intensity maximum and Model B an equivalent vortex centered on the secondary maximum. Model C presents the kinematic signature for two smaller vortices at these positions.
Current usage metrics show cumulative count of Article Views (full-text article views including HTML views, PDF and ePub downloads, according to the available data) and Abstracts Views on Vision4Press platform.
Data correspond to usage on the plateform after 2015. The current usage metrics is available 48-96 hours after online publication and is updated daily on week days.
Initial download of the metrics may take a while.