Fig. 2
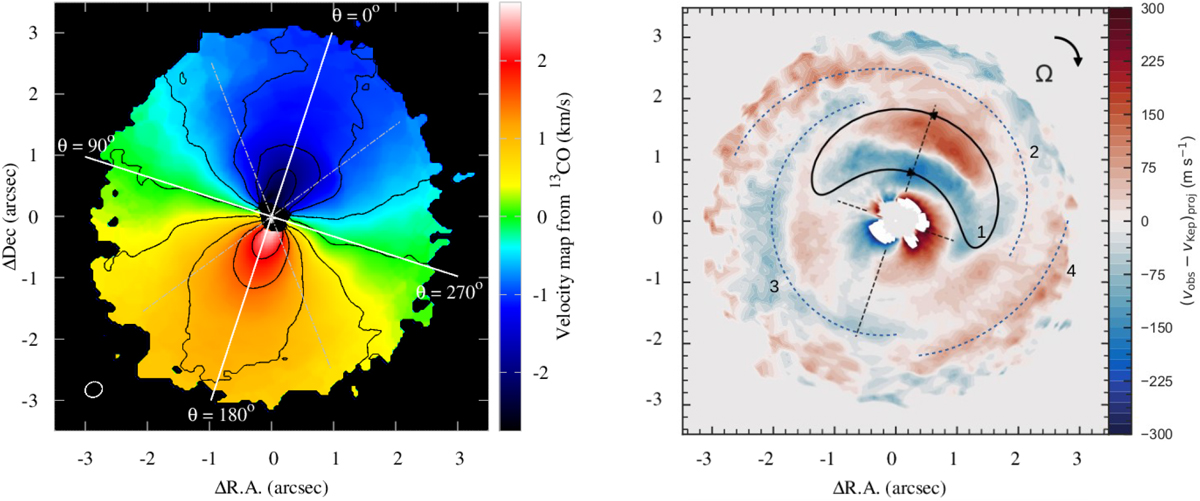
Gas velocity of the circumbinary disk. Left: 13CO J = 3–2 velocity map performed using the intensity weighted method, and subtracted by the systemic velocity of 3.73 km s−1. Contours are displayed from −2.75 to 2.75 km s−1 and are spaced by 0.5 km s−1. Right: blue- and redshifted velocities (indicated by blue and red colors) along the line-of-sight compared to the Keplerian rotation, as expressed by Eq. (1). A polar ellipse represented by a black solid line denoted (1) indicates the potential presence of a anticyclonic vortex, and three spiral-like structures in black dotted-line denoted (2), (3), and (4) are superimposed.
Current usage metrics show cumulative count of Article Views (full-text article views including HTML views, PDF and ePub downloads, according to the available data) and Abstracts Views on Vision4Press platform.
Data correspond to usage on the plateform after 2015. The current usage metrics is available 48-96 hours after online publication and is updated daily on week days.
Initial download of the metrics may take a while.