Fig. B.1
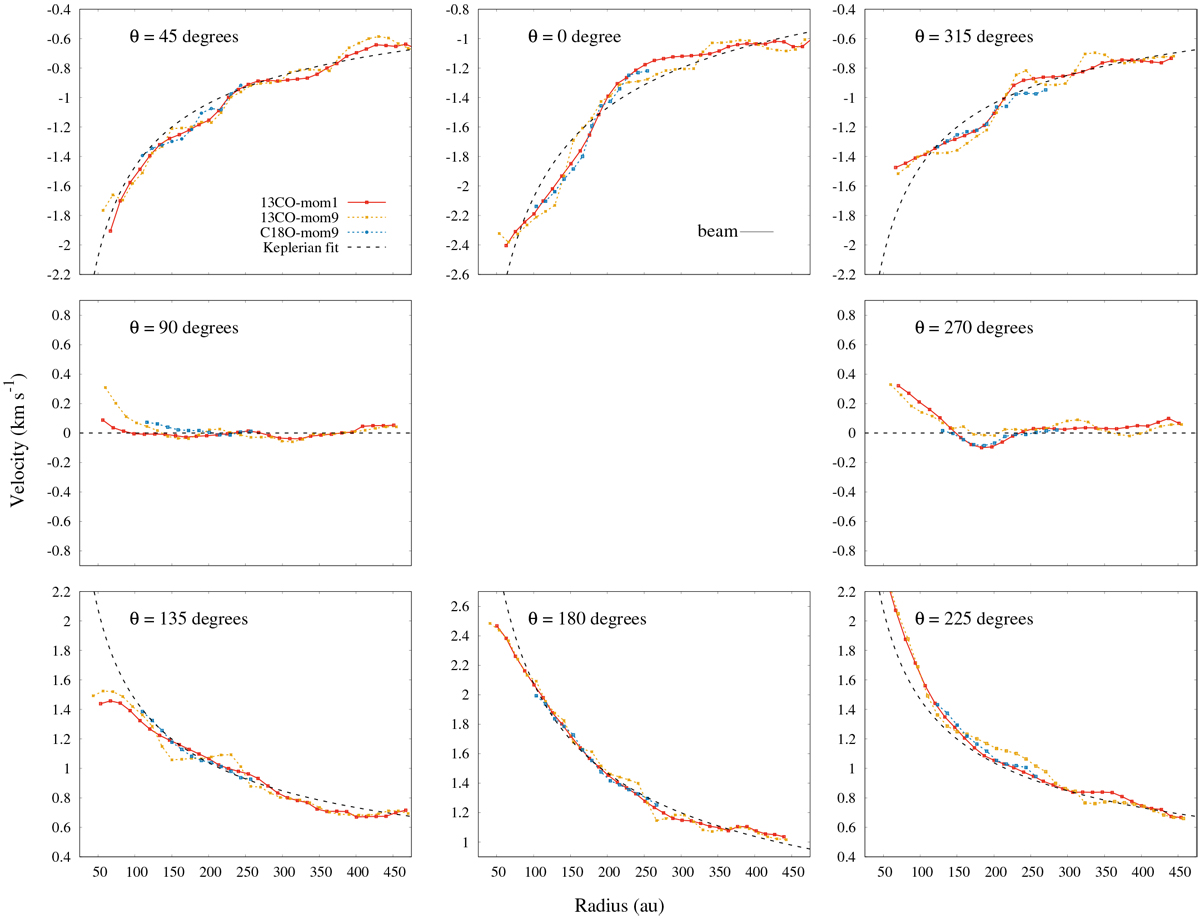
Radial profiles of the velocity for different PAs θ, spaced by 45°, where θ is the angle starting from the northern major axis and rotating counterclockwise. The red curve isthe velocity measured using the intensity weighted method (mom1 in CASA) with 13CO J = 3–2. The orange and blue curves correspond to the velocity measured using the peak emission method with the 13CO J = 3–2 and C18O J = 3–2 transition lines, respectively, with the procedure detailed in Teague & Foreman-Mackey (2018).
Current usage metrics show cumulative count of Article Views (full-text article views including HTML views, PDF and ePub downloads, according to the available data) and Abstracts Views on Vision4Press platform.
Data correspond to usage on the plateform after 2015. The current usage metrics is available 48-96 hours after online publication and is updated daily on week days.
Initial download of the metrics may take a while.