Fig. 8
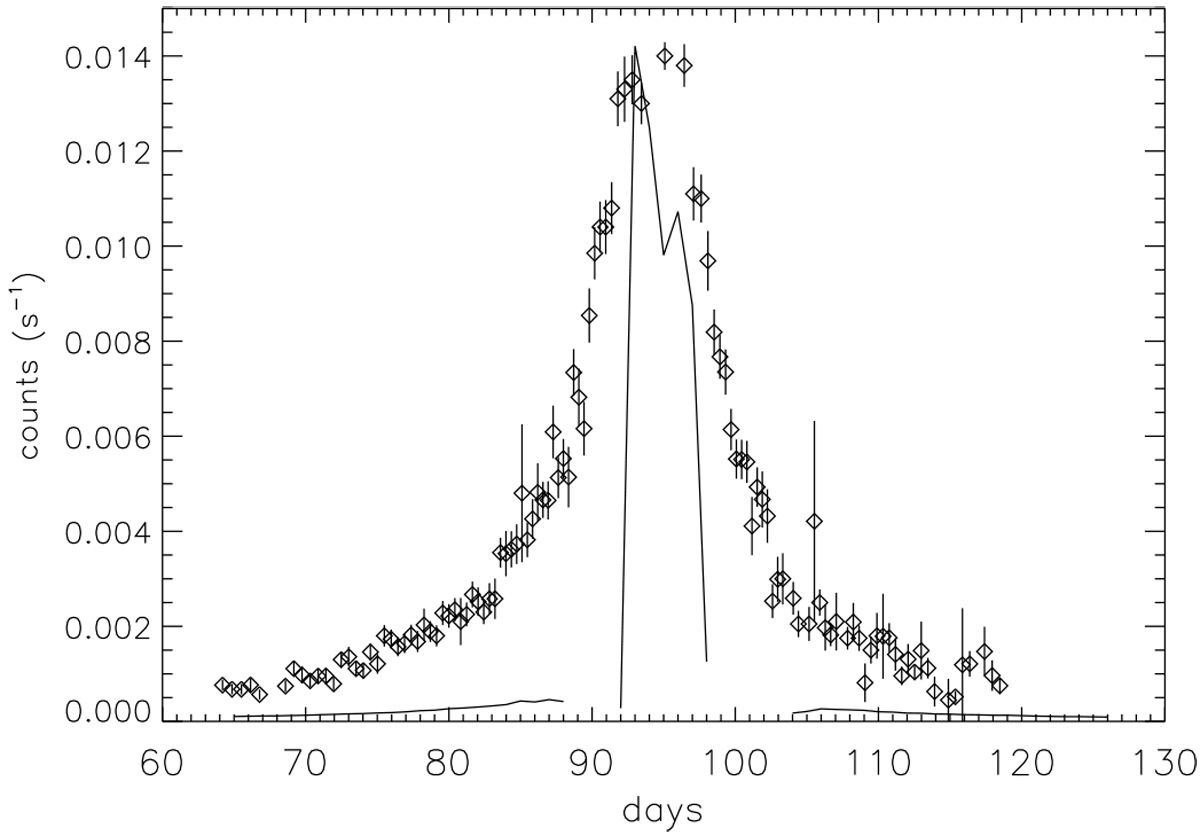
Comparison of calculated fluxes to PSP observations. The solid line shows the estimated flux of 30 to 40 nm particles relative to PSP, assuming Q/m = 10−6 e∕mp and β = 0.163. To agree with the observed impact rate at the perihelion, the calculated flux had to be multiplied by a factor of 4.5 × 104 cm2. We note thelow flux intensity away from the peak.
Current usage metrics show cumulative count of Article Views (full-text article views including HTML views, PDF and ePub downloads, according to the available data) and Abstracts Views on Vision4Press platform.
Data correspond to usage on the plateform after 2015. The current usage metrics is available 48-96 hours after online publication and is updated daily on week days.
Initial download of the metrics may take a while.