Fig. 7
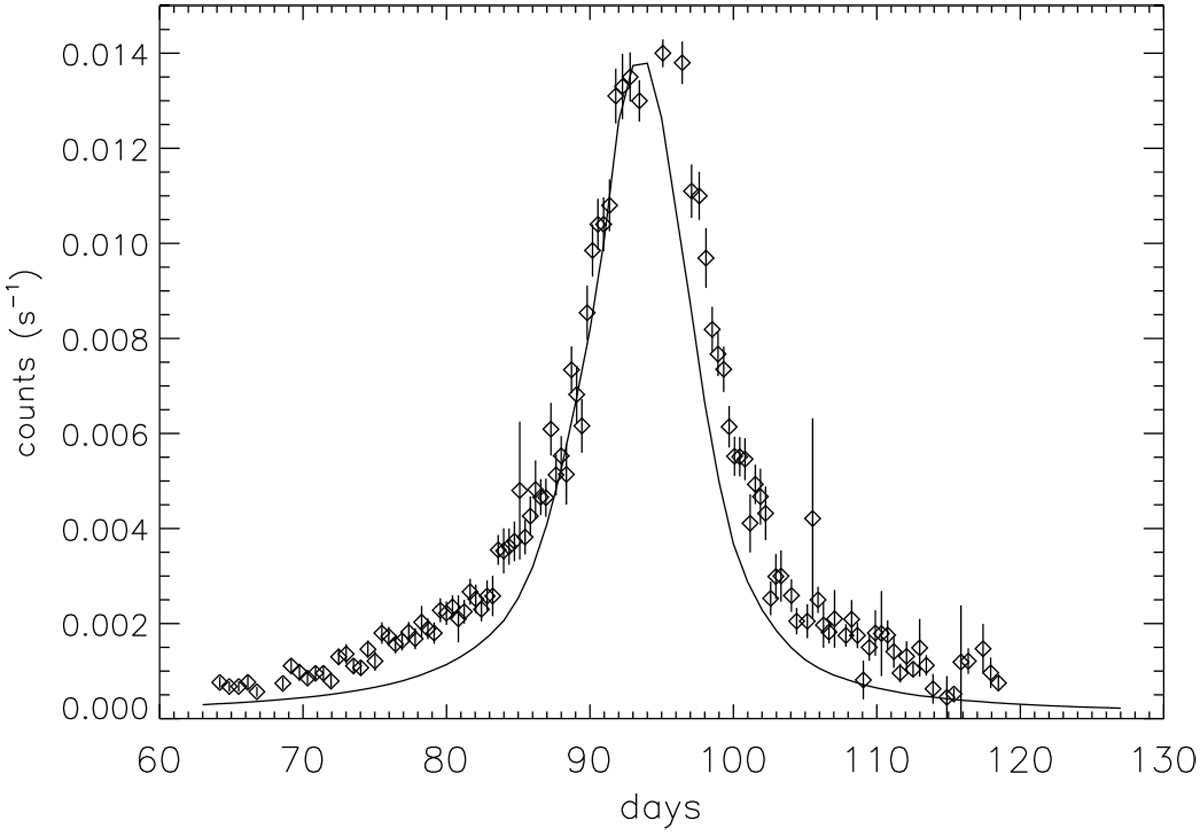
Comparison of calulated fluxes to PSP observations. The solid line shows the calculated flux of 100 to 140 nm particles assuming Q/m = 10−7 e∕mp and β = 0.751 (asteroidal dust material). The simulated flux values were adjusted to the impact rate observed at the perihelion, assuming a spacecraft cross section of 3 × 104 cm2.
Current usage metrics show cumulative count of Article Views (full-text article views including HTML views, PDF and ePub downloads, according to the available data) and Abstracts Views on Vision4Press platform.
Data correspond to usage on the plateform after 2015. The current usage metrics is available 48-96 hours after online publication and is updated daily on week days.
Initial download of the metrics may take a while.