Fig. 1.
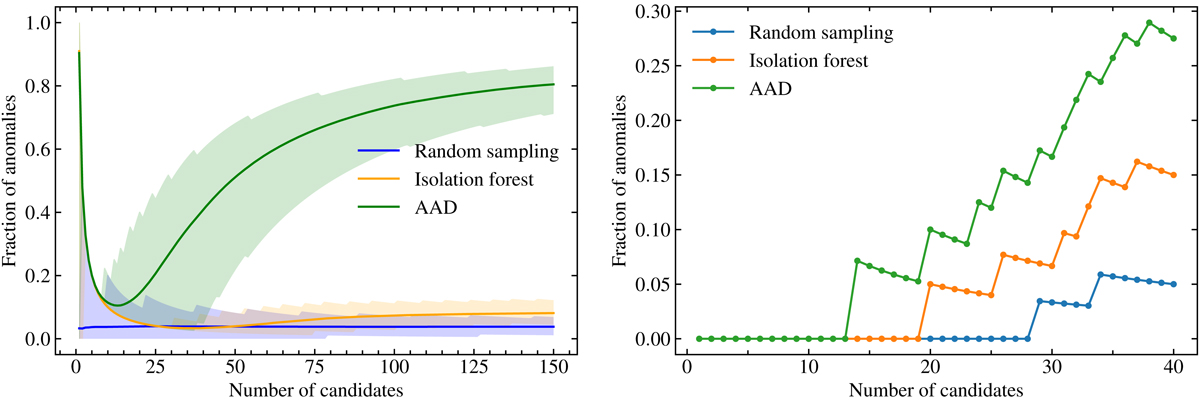
Fraction of anomalies as a function the total number of candidates scrutinized by the expert. The plot shows results obtained with the RS (blue), IF (orange), and Active Anomaly Discovery (green) algorithms. Left: results from the simulated PLAsTiCC data set. The solid lines represent the mean, and the shaded regions mark the 5–95 percentiles of results obtained from 2000 realizations with different random seeds. Right: results from the real OSC data.
Current usage metrics show cumulative count of Article Views (full-text article views including HTML views, PDF and ePub downloads, according to the available data) and Abstracts Views on Vision4Press platform.
Data correspond to usage on the plateform after 2015. The current usage metrics is available 48-96 hours after online publication and is updated daily on week days.
Initial download of the metrics may take a while.