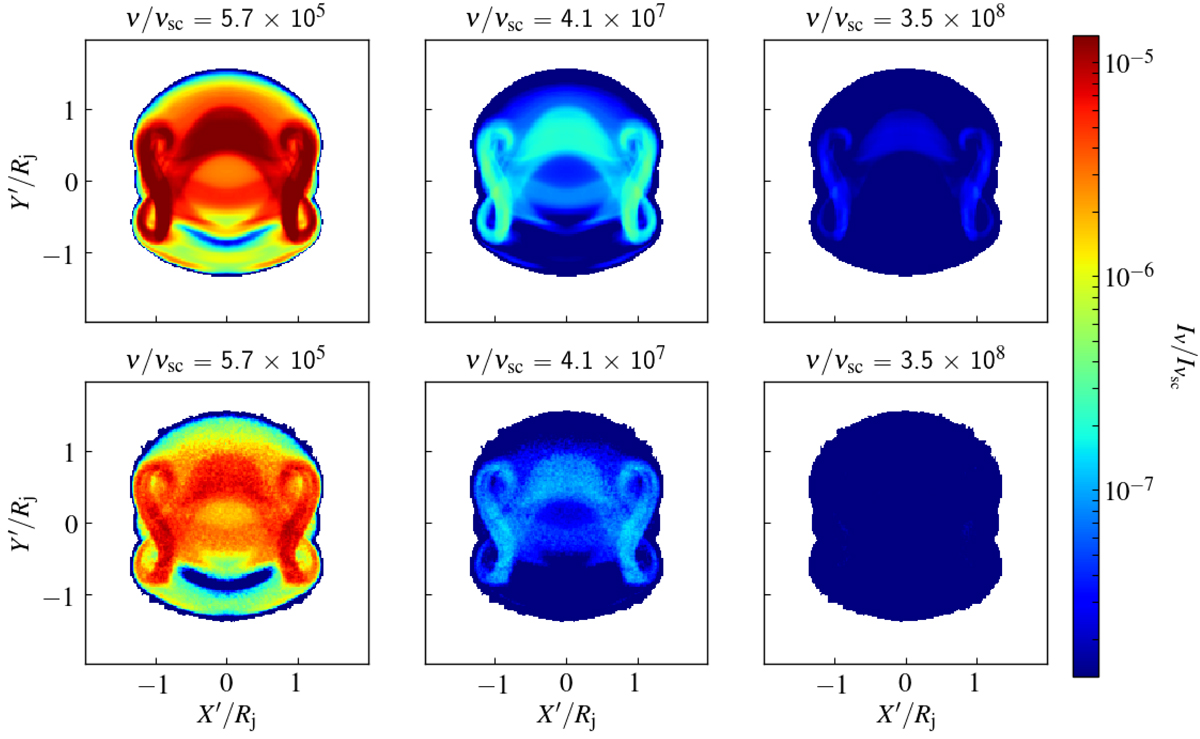
Fig. 5.

Synchrotron emission maps produced using the static particle spectra (top panels) and evolving particle spectra (bottom panels) with an initial power-law index p = 3 for case UNI-A at t/ta = 2.25 projected on the sky plane X′–Y′. These maps are obtained for a direction along a line of sight inclined at 20° with the jet axis at three different observing frequencies normalized to the frequency scale νsc = 122 Hz. The color bar represents the magnitude of specific intensity Iν normalized to the specific intensity scale Iνsc = 7.46 × 10⁻⁹ ergs s−1 cm−2 Hz−1 str−1.
Current usage metrics show cumulative count of Article Views (full-text article views including HTML views, PDF and ePub downloads, according to the available data) and Abstracts Views on Vision4Press platform.
Data correspond to usage on the plateform after 2015. The current usage metrics is available 48-96 hours after online publication and is updated daily on week days.
Initial download of the metrics may take a while.


