Fig. 5.
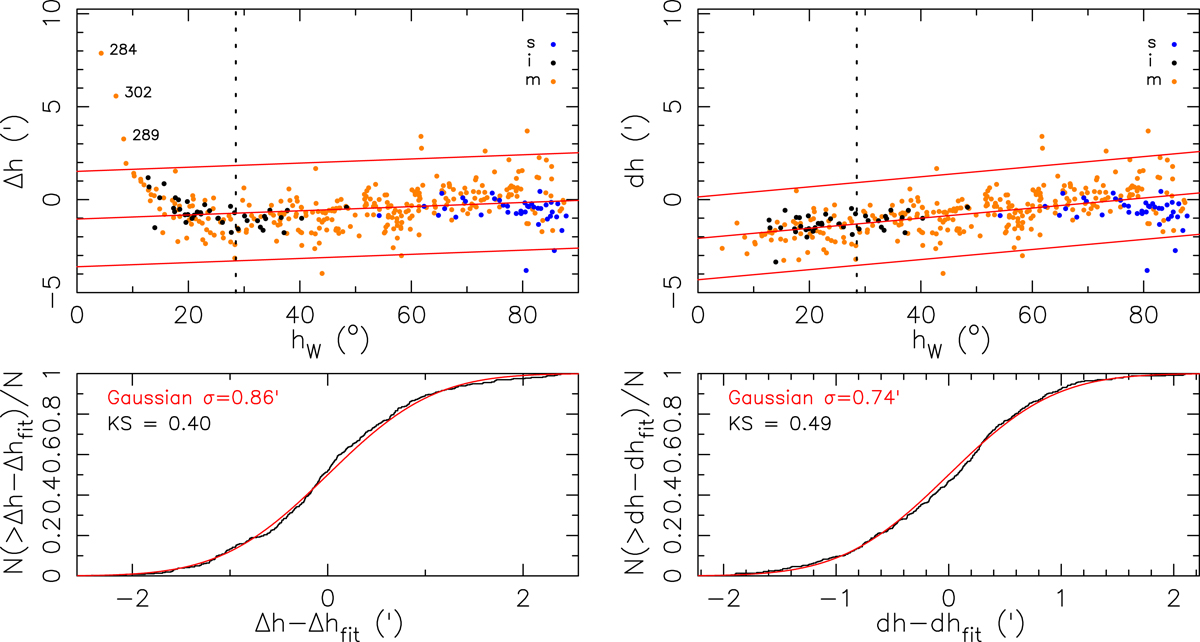
Top: differences Δh (left) and dh (right) between the altitudes measured in Kassel and the altitudes that should have been measured according to modern data (Eqs. (17) and (18)). The solid lines show the best linear fit and its 3-rms range. Points outside this range were ignored in the fit. To the right of the dashed vertical line RR = 0 and thus Δh = dh. Bottom: cumulative distribution of the difference between the measured Δh and dh and their best fit, compared with the distribution expected for a Gaussian with σ equal to the rms of the differences with the best fit. KS indicates the p-value from a two-sided Kolmogorov-Smirnov test for which the observed points are drawn from the Gaussian.
Current usage metrics show cumulative count of Article Views (full-text article views including HTML views, PDF and ePub downloads, according to the available data) and Abstracts Views on Vision4Press platform.
Data correspond to usage on the plateform after 2015. The current usage metrics is available 48-96 hours after online publication and is updated daily on week days.
Initial download of the metrics may take a while.