Fig. 4.
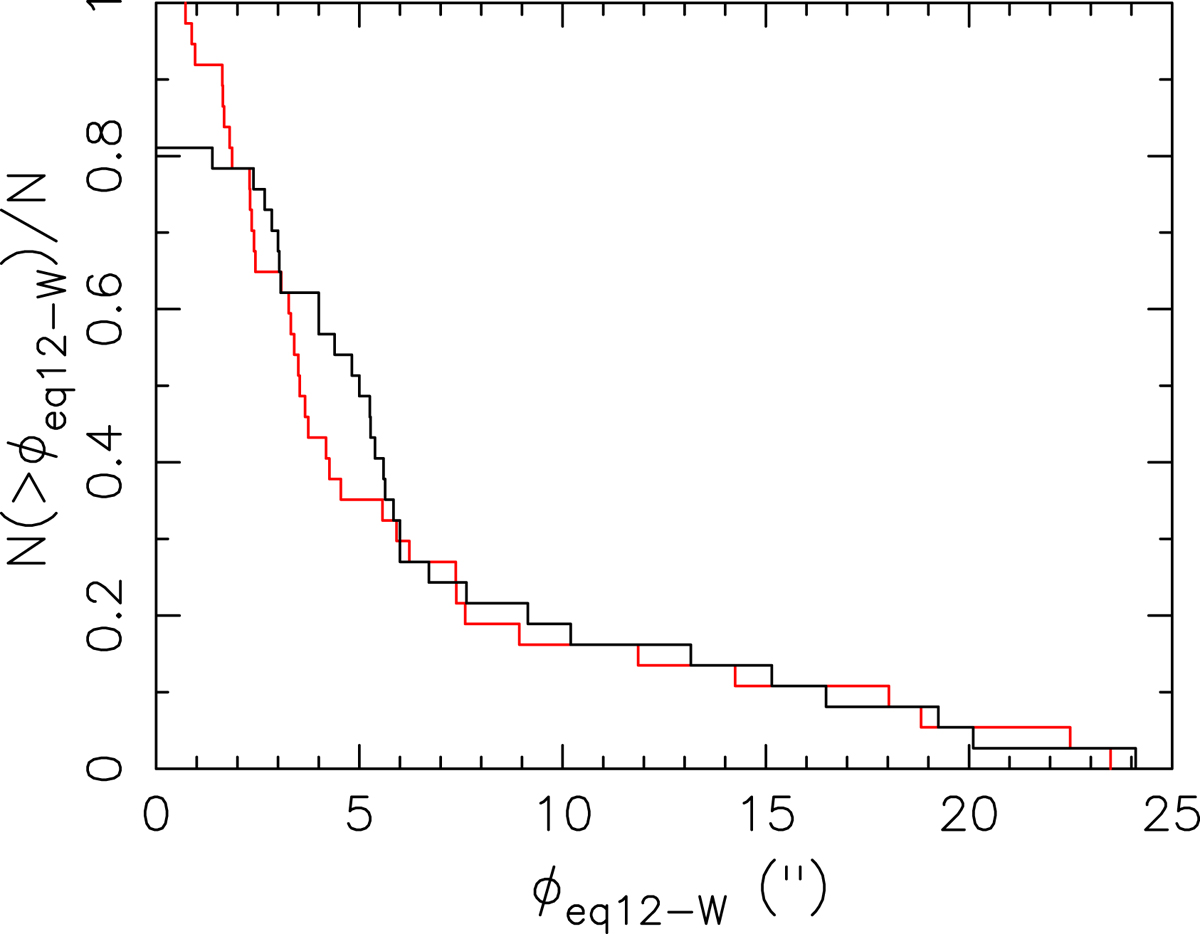
Complement to the normalised empirical cumulative distribution function, i.e. 1-ECDF of the differences ϕeq12 − W between the position computed with Eq. (15) and the catalogued position. Red: vertical axis for the exact computed values λeq12 and βeq12. Black: for the values rounded to the nearest allowed integer of Sλ and Sβ.
Current usage metrics show cumulative count of Article Views (full-text article views including HTML views, PDF and ePub downloads, according to the available data) and Abstracts Views on Vision4Press platform.
Data correspond to usage on the plateform after 2015. The current usage metrics is available 48-96 hours after online publication and is updated daily on week days.
Initial download of the metrics may take a while.