| Issue |
A&A
Volume 649, May 2021
First science highlights from SRG/eROSITA
|
|
|---|---|---|
| Article Number | L11 | |
| Number of page(s) | 9 | |
| Section | Letters to the Editor | |
| DOI | https://doi.org/10.1051/0004-6361/202140317 | |
| Published online | 07 May 2021 | |
Letter to the Editor
The eROSITA Final Equatorial-Depth Survey (eFEDS)
An X-ray-bright, extremely luminous infrared galaxy at z = 1.87
1
Department of Astronomy, Kyoto University,
Kitashirakawa-Oiwake-cho, Sakyo-ku,
Kyoto
606-8502,
Japan
e-mail: This email address is being protected from spambots. You need JavaScript enabled to view it.
2
Academia Sinica Institute of Astronomy and Astrophysics,
11F of Astronomy-Mathematics Building, AS/NTU, No. 1, Section 4, Roosevelt Road,
Taipei
10617,
Taiwan
3
Research Center for Space and Cosmic Evolution, Ehime University,
2-5 Bunkyo-cho, Matsuyama,
Ehime
790-8577,
Japan
4
Dipartimento di Fisica e Astronomia, Università di Bologna,
via Gobetti 93/2,
40129
Bologna,
Italy
5
INAF – Osservatorio di Astrofisica e Scienza dello Spazio di Bologna,
via Gobetti 93/3,
40129
Bologna,
Italy
6
Max-Planck-Institut für Extraterrestrische Physik (MPE),
Giessenbachstrasse 1,
85748
Garching bei München,
Germany
7
Leibniz-Institut für Astrophysik, Potsdam (AIP),
An der Sternwarte 16,
14482
Potsdam,
Germany
8
Astronomical Institute, Tohoku University,
6-3 Aramaki, Aoba-ku,
Sendai,
Miyagi
980-8578,
Japan
9
Department of Astrophysical Sciences, Princeton University,
Princeton,
NJ
08540,
USA
10
Faculty of Science and Engineering, Kindai University,
Higashi-Osaka
577-8502,
Japan
11
Department of Economics, Management and Information Science, Onomichi City University,
Hisayamada 1600-2, Onomichi,
Hiroshima
722-8506,
Japan
Received:
12
January
2021
Accepted:
2
April
2021
Abstract
In this study, we investigate the X-ray properties of WISE J090924.01+000211.1 (WISEJ0909+0002), an extremely luminous infrared (IR) galaxy (ELIRG) at zspec = 1.871 in the eROSITA Final Equatorial-Depth Survey. WISEJ0909+0002 is a WISE 22 μm source, located in the GAMA-09 field, which was detected by eROSITA during the performance and verification phase. The corresponding optical spectrum indicates that this object is a type-1 active galactic nucleus (AGN). Observations from eROSITA combined with Chandra and XMM-Newton archival data indicate a very luminous (L (2–10 keV) = (2.1 ± 0.2) × 1045 erg s−1) unobscured AGN with a power-law photon index of Γ=1.73−0.15+0.16 and an absorption hydrogen column density of log (NH∕cm−2) < 21.0. The IR luminosity was estimated to be LIR = (1.79 ± 0.09) × 1014 L⊙ from spectral energy distribution modeling based on 22 photometric data points (X-ray to far-IR) with X-CIGALE, which confirmed that WISEJ0909+0002 is an ELIRG. A remarkably high LIR despite very low NH would indicate that we are witnessing a short-lived phase in which hydrogen gas along the line of sight is blown outward, whereas warm and hot dust heated by AGNs still exists. As a consequence of the eROSITA All-Sky Survey, 6.8−5.6+16 × 102 such X-ray-bright ELIRGs are expected to be discovered in the entire extragalactic sky (|b| > 10°). This can potentially be the key population to constrain the bright end of IR luminosity functions.
Key words: galaxies: active / X-rays: galaxies / infrared: galaxies / quasars: individual: WISE J090924.01+000211.1
© ESO 2021
1 Introduction
Galaxies with infrared (IR) luminosity (LIR1) greater than 1013 L⊙ and 1014 L⊙ have been termed as hyper-luminous IR galaxies (HyLIRGs; Rowan-Robinson 2000) and extremely luminous IR galaxies (ELIRGs; Tsai et al. 2015), respectively. The IR luminosity can arise from active galactic nucleus (AGN) and star formation (SF) activity. During galactic merger events, these luminous IR galaxy populations may correspond to a phase in which the AGN and SF activity reach a peak, shrouded by dense gas and dust clouds (e.g., Hopkins et al. 2008; Narayanan et al. 2010; Toba et al. 2015; Blecha et al. 2018). Systematic investigations on HyLIRGs and ELIRGs are required to cement our understanding of the coevolution of such galaxies and their supermassive black holes (SMBHs) during the peak of AGN and SF activity.
Since the advent of IR satellites such as the Wide-field Infrared Survey Explorer (WISE; Wright et al. 2010) and the Herschel Space Observatory (Pilbratt et al. 2010), a large number of HyLIRGs and ELIRGs have been discovered (e.g., Casey et al. 2012; Weedman et al. 2012; Leipski et al. 2014; Toba & Nagao 2016; Duras et al. 2017). However, accurate characterization of the properties of ELIRGs based on multiwavelength spectral energy distribution (SED) is limited (see, e.g., Toba et al. 2018, 2020b). In particular, X-ray properties of ELIRGs such as hydrogen column density (NH) and absorption-corrected X-ray luminosity are poorly understood.
The extended ROentgen Survey with an Imaging Telescope Array (eROSITA; Merloni et al. 2012; Predehl et al. 2021) has recently probed the X-ray properties of ELIRGs. eROSITA is the primary instrument on the Spectrum-Roentgen-Gamma (SRG) mission, which was successfully launched on July 13, 2019. Since ELIRGs are a spatially rare population and may be X-ray-faint due to obscuration, the eROSITA all-sky survey with high X-ray sensitivity is an ideal platform for investigating the X-ray properties of ELIRGs. In this Letter, we report the eROSITA view of the ELIRG at zspec = 1.871, WISE J090924.01+000211.1 (hereafter WISEJ0909+0002) in the GAMA-09 field observed by eROSITA. We employed the performanceand verification (PV) phase program called eROSITA Final Equatorial Depth Survey (eFEDS; Brunner et al., in prep.) in our observation. The eFEDS catalog contains approximately 28 000 X-ray point sources detected over an area of 140 deg2 in a single broad band, with a5σ sensitivity of f0.3–2.3 keV ~ 9 × 10⁻¹⁵ erg s−1 cm−2. We discuss the AGN of WISEJ0909+0002 as well as the AGN host properties based on SED fitting and X-ray spectral analysis. Throughout this Letter, the adopted cosmology is a flat universe with H0 = 70 km s−1 Mpc−1, ΩM = 0.3, and ΩΛ = 0.7, and the initial mass function (IMF) of Chabrier (2003) is assumed.
2 Data and analysis
2.1 The candidate ELIRG WISEJ0909+0002
WISEJ0909+0002 is an ELIRG candidate detected by eROSITA with a positional uncertainty of 2.′′ 0. It is the only ELIRG candidate detected by eROSITA in a sample of ~300 WISE 22 μm-selected sources2 in the eFEDS area with multiwavelength data (~ 50 deg2; Toba et al., in prep.). This object is included in the eFEDS X-ray point source catalog with optical-to-mid-IR (MIR) counterparts (Salvato et al., in prep.) called eFEDSJ090924.0+000209.9. The optical-MIR counterparts were identified using data from the DESI Legacy Imaging Surveys Data Release 8 (LS8: Dey et al. 2019), which includes g, r, and z data from the Dark Energy Camera Legacy Survey (DECaLS) as well as 3.4, 4.6, 12, and 22 μm data from unWISE (Lang 2014; Lang et al. 2016). The optical-MIR counterparts were determined using a Bayesian statistics-based algorithm (NWAY Salvato et al. 2018) and the maximum likelihood method (see Salvato et al. for details), and the multiwavelength data were compiled (see Toba et al. for details). First, we used absorption-corrected fluxes in the 0.5–2.0 and 2.0–10 keV bands obtained via X-ray spectroscopy (see Sect. 2.3). The UV data were adopted from the Galaxy Evolution Explorer (GALEX; Martin et al. 2005; Bianchi 2011). Other optical (u, i, and Y) and near-IR (NIR) data (J, H, and Ks) were adopted from the Kilo-Degree Survey (KiDS) fourth data release (DR4; Kuijken et al. 2019). The far-IR (FIR) data (100, 160, 250, 350, and 500 μm) were adopted from the H-ATLAS DR1 (Valiante et al. 2016). The photometry of WISEJ0909+0002 is presented in Table A.1. We were able to confirm the classification of WISEJ0909+0002 as an ELIRG from the SED fitting (see Sects. 2.2 and 3.1), and the redshift was determined spectroscopically using the Sloan Digital Sky Survey (SDSS; York et al. 2000) to be zspec = 1.871. The observed properties of WISEJ0909+0002 are summarized in Table 1.
Observed properties of WISEJ0909+0002.
2.2 SED fitting with X-CIGALE
To estimate the IR luminosity with high precision, we conducted SED fitting by considering the energy balance between the UV-to-optical and IR ranges. We employed the new version of the Code Investigating GALaxy Emission (CIGALE; Burgarella et al. 2005; Noll et al. 2009; Boquien et al. 2019) called X-CIGALE3 (Yang et al. 2020), which enables SED fitting in the X-ray-to-radio range. In X-CIGALE, we are able to handle many parameters, such as the star formation history (SFH), single stellar population (SSP), attenuation law, AGN emission, dust emission, radio synchrotron emission, and AGN X-ray emission (see, e.g., Boquien et al. 2014, 2016; Buat et al. 2015; Lo Faro et al. 2017; Toba et al. 2019b, 2020c). A brief description of each parameter is provided in Appendix B, and the parameter ranges used in the SED fitting are presented in Table B.1 (see also Boquien et al. 2019; Yang et al. 2020, and references therein).
2.3 X-ray spectral analysis
WISEJ0909+0002 was observed by eROSITA with a net exposure time of 2.3 ks in 2019. The eROSITA X-ray spectrum of WISEJ0909+0002 was extracted using eSASS srctool v1.604 within a circle of 50′′ in diameter, and the background spectrum was extracted inside an annulus between 114′′ and 623′′, excluding all nearby sources (see Liu et al., in prep., in details). This source was observed by Chandrain 2004 (Observation ID = 5703) and by XMM-Newton in 2013 (Observation ID = 0725310143). We extracted the Chandra and XMM spectra to perform a joint fitting of the eROSITA spectrum in the 0.2–8 keV band (90 net counts), the Chandra spectrum in the 0.5–7 keV band (17 net counts), and the XMM EPIC-pn, EPIC-MOS1, and EPIC-MOS2 spectra in the 0.5–8 keV band (with net counts of 33, 11, and 14, respectively).
The Chandra data were processed with CIAO 4.12 and CALDB 4.9.0. The background was stable during the observation with a net exposure time of 1.3 ks. The source spectrum was extracted from a circular region centered at WISEJ0909+0002 with a radius of 4.′′ 9. The background spectrum was obtained from an annular region around the source. The XMM-Newton data were processed with the science analysis system version 18.0.0, combined with the calibration files that were current as of June 2019. The source spectra were extracted from a circular region with a radius of 17.′′ 5. The background spectra were adopted from a nearby source-free region. The background was stable during the observation, and the net exposure times for the PN, MOS1, and MOS2 detectors were 2.5, 2.7, and 2.7 ks, respectively.
We modeled the source with a power-law model with galactic absorption (NH = 2.58 × 1020 cm−2) and intrinsic absorption (constant*TBabs*zTBabs*powerlaw in xspec). Two constant factors (0.65 for Chandra and 1.36 for XMM) were used to account for the potential variability and calibration difference between eROSITA, Chandra, and XMM (but see Appendix D). We also fitted the spectra with the same model, setting all the constant factors to unity, in order to measure the averaged luminosity. Fixing these factors has no impact on the spectral shape parameters because the XMM and Chandra spectra have much lower counts than those of eROSITA. To derive constraints on the parameters, we employed the Bayesian method BXA (Buchner et al. 2014; Buchner 2019), adopting wide uniform priors for the power-law slope and the constant factors and adopting log-uniform priors for the column density and normalization. In Table 1, we list the posterior median and 68% confidence interval of the parameters, as well as the absorption-corrected rest-frame 2–10 keV luminosity (see also Sect. 3.2).
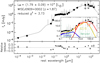 |
Fig. 1 Best-fit SED of WISEJ0909+0002. The black points are photometric data, and the solid gray line represents the resultant best-fit SED. The inset figure shows the SED at 0.1–500 μm, where the contributions from the stellar, nebular, AGN, and SF components to the total SED are shown as blue, green, yellow, and red lines, respectively. The relative residual (defined as (data – best-fit)/data) are shown at the bottom, where the black line represents the case in which the residual is zero. |
3 Results and discussion
3.1 IR luminosity and host properties
Figure 1 shows the best-fit SED of WISEJ0909+0002 (see also Fig. C.1 for multiwavelength images). We find that the observed data points (except for the observed-frame optical data) are explained well by the combination of stellar, nebular, AGN, and SF components. The best-fit SED, particularly of the AGN accretion disk, underestimates the flux densities in the rest-frame 0.1–1 μm by 0.2–0.3 dex, which induces a relatively large reduced χ2 (= 3.7). This is partially due to the fact that X-CIGALE fixes a slope of the power-law disk component (i.e., the optical spectral index, αopt) to be 0.5 in λ–fν space, where αopt is defined in the wavelength rage 0.125–1 μm (see Eq. (9) in Yang et al. 2020). However, the αopt for WISEJ0909+0002 inferred from the SDSS spectrum and NIR data is ~ 0.25, which is flatter than that employed in X-CIGALE. The relative residual defined as (data – best-fit)/data is also plotted in the bottom panel of Fig. 1. In the optical–NIR region, the relative residual is slightly larger at shorter wavelengths, which can support the above interpretation.
The resultant IR luminosity is LIR = (1.79 ± 0.09) × 1014 L⊙, which establishes the classification of WISEJ0909+0002 as an ELIRG. The AGN fraction defined as LIR (AGN)/LIR is ~ 0.4, suggesting that the LIR for WISEJ0909+0002 may have contributions from AGNs and SF. We note that recent SED fitting codes such as CIGALE and Multiwavelength Analysis of Galaxy Physical Properties (MAGPHYS; da Cunha et al. 2008) employ physically motivated LIR without anyboundary for the integration range for the wavelength. Hence, X-CIGALE purely considers the energy reemitted by dust that absorbs UV–optical photons from the AGN and SF components to estimate LIR (see also Toba et al. 2020b).
The derived color excess of the stellar emission ( ), stellar mass (M*), and star formation rate (SFR) output from X-CIGALE are
  , M* = (4.94 ± 1.39) × 1011 M⊙, and SFR = (3.85 ± 0.06) × 103 M⊙ yr−1, respectively;the SFR was estimated based only on the resultant parameters of the SFH output by X-CIGALE (see Boquien et al. 2019, for more details). The M* –SFR relation of WISEJ0909+0002 shows a significant positive offset (~1 dex) with respect to the main-sequence galaxies at 1.5 < z < 2 for the samestellar mass (Tomczak et al. 2016; Pearson et al. 2018). This indicates that WISEJ0909+0002 can be considered a starburst galaxy. We note that it is often difficult to decompose the UV-to-optical SED of quasars into stellar and AGN emission with limitedphotometric data (see, e.g., Merloni et al. 2010; Bongiorno et al. 2012; Toba et al. 2018). Hence, the derived M* may have a largeuncertainty due to possible contamination from emission from the AGN accretion disk. Recent works have also reported that AGNs with higher luminosities exhibit higher AGN contribution to FIR emission than less luminous AGNs (e.g., Symeonidis et al. 2016; Symeonidis 2017). It has been shown that contribution from the AGN torus to FIR emission is small, and FIR emission can be predominantly linked to dust heated by the AGN at kiloparsec scales. Since the SED modeling in our study does not take such dust into account, the derived fAGN and SFR may be underestimated and overestimated, respectively. Nevertheless, given the fact that possible underestimated or overestimated values for M* and SFR for type-1 AGNs are expected to be 0.3 dex (e.g., Symeonidis et al. 2016; Toba et al., in prep.), our conclusion, that WISEJ0909+0002 can be considered a starburst galaxy, is reasonable.
3.2 AGN properties
To the best of our knowledge, this is the first work on eROSITA data to determine the X-ray properties of an ELIRG directly from the X-ray spectra6. Figure 2 shows the X-ray spectra of WISEJ0909+0002, in which the data are well fitted using the model described in Sect. 2.3. The resulting values of the photon index (Γ), NH, and absorption-corrected hard X-ray luminosity in the rest-frame 2–10 keV band (L2−10 keV) are  , log (NH∕cm−2) < 21.0, and L2−10 keV = (2.1 ± 0.2) × 1045 erg s−1, respectively. These values are typical for luminous unobscured type-1 AGNs.
WISEJ0909+0002 exhibits broad emission lines of C iv and Mg ii with full width at half maximum (FWHM) values of 5580 ± 102 and 6173 ± 115 km s−1, respectively (Rakshit et al. 2020), in the SDSS spectrum. Rakshit et al. (2020) measured the monochromatic luminosity at 3000 Å7 (L3000 = 7.2 × 1046 erg s−1) and the FWHM of Mg ii, which contribute to the bolometric luminosity (Lbol) and black hole mass (MBH), by using multicomponent spectral fitting. The Lbol was then calculated using L3000 × BC3000, where BC3000 is bolometric correction (BC3000 = 5.9 ± 0.8; Nemmen & Brotherton 2010; Runnoe et al. 2012). The MBH value was estimated using the single epoch method reported by Vestergaard & Osmer (2009). The uncertainty in Lbol and MBH was calculated through error propagation in the same manner as in Toba et al. (2021).
The resultant Lbol and MBH are Lbol = (4.3 ± 0.6) × 1047 erg s−1 and MBH = (7.4 ± 0.3) × 109 M⊙. The Eddington ratio (λEdd = Lbol∕LEdd) was determined to be λEdd = 0.4 ± 0.1. Following Toba et al. (2017), we estimated Lbol by integrating the best-fit SED template of the AGN component output by X-CIGALE over wavelengths longward of Lyα. We obtained  , which is consistent with the Lbol value derived from the SDSS spectrum, within the error.
It has been reported that the hard X-ray bolometric correction κX (=Lbol∕L2−10 keV) is strongly luminosity-dependent at high luminosities (e.g., Lusso et al. 2010; Duras et al. 2020). The resulting κX of WISEJ0909+0002 is (2.0 ± 0.3) × 102, which is consistent with the value obtained via an empirical relationship between κX and Lbol for type-1 AGNs (κX ~ 2078) with a dispersion of 0.26 dex, as reported by Duras et al. (2020). The κX was also correlated with MBH and λEdd (e.g., Vasudevan & Fabian 2007; Lusso et al. 2012; Martocchia et al. 2017). The measured value of κX is larger than the values estimated from empirical relations for the type-1 AGNs of κX –MBH (~113) and κX –λEdd (~153) reported in Martocchia et al. (2017) and Lusso et al. (2012), respectively, but still consistent with them within the scatters of the correlations. We conclude that the observed AGN properties (MBH, Lbol, LX, and λEdd) of WISEJ0909+0002 follow the empirical relations for type-1 AGNs that have previously been reported.
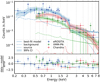 |
Fig. 2 X-ray spectra of eROSITA (blue), EPIC-pn (green), and Chandra (red) folded with the energy responses and fitted with the same model (absorbed power-law). The data are binned to a minimum significance of 2σ
for convenience. The best-fit model and the corresponding 99% confidence interval are displayed in blue, green, and red for eROSITA, EPIC-pn, and Chandra, respectively. The lower panel displays the (data-model)/ |

3.3 Expected surface number density of X-ray-bright ELIRGs
Here, we discuss the number of X-ray-bright ELIRGs expected to be discovered as a consequenceof the eROSITA All-Sky Survey (eRASS) that will continue until the end of 2023 (Predehl et al. 2021). Following Toba & Nagao (2016), we estimated the surface number density by taking into account the survey area addressed inthis work and the detection completeness of the WISE and eROSITA all-sky surveys. The footprint of the ELIRG survey in the eFEDS (GAMA-09 field) is currently determined by the overlapping region of KiDS DR4 and H-ATLAS DR1, which is approximately 50 deg2 (e.g., Fleuren et al. 2012). WISEJ0909+0002 was drawn from the 22 μm-selected sample, and its flux density at 22 μm (~ 30 mJy) is well above the fluxes at the 95% completeness limit9 (~7 mJy). The X-ray flux in the 0.5–2 keV band of WISEJ0909+0002 is ~ 1.6 × 10⁻¹³ erg s−1 cm−2, which is roughly one order of magnitude brighter than that at 95% completeness (~ 2 × 10⁻¹⁴ erg s−1 cm−2; Merloni et al. 2012). Therefore, the expected surface number density of X-ray-bright ELIRGs is 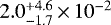 deg−2, where the 1σ confidence limits are estimated based on the Poisson statistics reported by Gehrels (1986). Thus,
  deg2 (corresponding to the sky area at
  objects are expected to be discovered in the entire extragalactic sky, which suggests that X-ray-bright ELIRGs are a rare population, and this phase appears on a significantly short timescale.
3.4 The evolutionary stage of WISEJ0909+0002
A remarkable property of WISEJ0909+0002 is the low NH (< 1021.0 cm−2), despite the fact that its LIR value is extraordinary large (i.e., this ELIRG is presumably embedded within a large amount of gas and dust). Furthermore, WISEJ0909+0002 is known as a broad absorption line (BAL) quasar (Trump et al. 2006; Ganguly et al. 2007; Moravec et al. 2017). To check the consistency of the NH derived from the X-ray spectral analysis, we estimated NH from an expected ionization parameter (U) inferred from the C iv λ1549 and N v λ1240 lines as follows. Moravec et al. (2017) reported that the lower limits of the column density (Nion) of C iv and the corresponding optical depth of the line center (τ0) are 2.89 × 1015 cm−2 and 0.55, respectively, while those of Nion and τ0 for N v are 5.61 × 1015 cm−2 and 0.7, respectively. This suggests that (i) the relative abundance of N v (N4+) is larger than that of C iv (C3+) and (ii) those ions are optically thin. Under the above conditions10, we estimated the lower limits to U and NH based on the photoionization calculations reported by Hamann et al. (2011) and Wang et al. (2015). As a result, we obtained log U > −1.2 and log (NH∕cm−2) > 21, which is consistent with what is derived by Xu et al. (2018) for other quasars with a BAL feature similar to that of WISEJ0909+0002.
The derived NH is larger than the value obtained from the X-ray spectral analysis. This discrepancy may be attributable depending on the level of certainty to the variability of NH. The BAL feature of WISEJ0909+0002 was reported based on the averaged UV-to-optical spectra measured in 2001–2010 (the averaged epoch is 2006). The Chandra X-ray spectrum was measured in 2004. If we derive NH only from Chandra, we obtain  (see Appendix D), which is roughly consistent with that estimated from the BAL feature. Since XMMand eROSITA observed this object in 2013 and 2019, respectively, it may be possible that the NH of WISEJ0909+0002 decreased in 10–15 years. Given the large uncertainty of the Chandra-based NH, it may be hard to conclude that this variability is significant. Nevertheless, if this drastic decline in NH is real, the BAL feature of the WISEJ0909+0002 spectra is expected to be weak, or even missing, in the current UV-to-optical spectra. This is an issue to be addressed in a future work.
Recent galactic merger simulations show that an evolutionary stage with a high LIR and a low NH appears for ~ 5–10 Myr during the major merger event in which hydrogen gas along the line of sight is blown outward, whereas warm and hot dust heated by AGNs still exists (Yutani et al., in prep.11). We checked images from the Hubble Space Telescope (HST) to see if there are any clues of a potential merger event, but no such observation is apparent in the image, as shown in Fig. C.1. The FWHM and radial profile of WISEJ0909+0002 are comparable to those of possible stars around our object in the same field of view of HST, suggesting that WISEJ0909+0002 can be considered as a point source. This may be because the merger sign is too weak to be detected currently, given the fact that an object with a low NH and a high LIR would appear in the late stage of a galactic merger (Yutani et al., in prep.). In addition, strong nuclear emissions often erase any trace of the merger sign. However, the optical spectrum exhibits a blue wing for some emission lines, such as C iii] (Rakshit et al. 2020), which may support the idea that this ELIRG is in the blow-out phase. Thus, we are witnessing a short-lived ELIRG phase in the course of galactic evolution. Owing to the rarity and the extreme luminosity, such X-ray-bright ELIRGs will be ideal environments for investigating the bright end of X-ray and IR luminosity functions.
Acknowledgements
We gratefully acknowledge the anonymous referee for a careful reading of the manuscript and very helpful comments. We thank Takashi Horiuch, Keiichi Wada, and Naomichi Yutani for useful discussion and comments. This work is based on data from eROSITA, the primary instrument aboard SRG, a joint Russian-German science mission supported by the Russian Space Agency (Roskosmos), in the interests of the Russian Academy of Sciences represented by its Space Research Institute (IKI), and the Deutsches Zentrum für Luft- und Raumfahrt (DLR). The SRG spacecraft was built by Lavochkin Association (NPOL) and its subcontractors, and is operated by NPOL with support from the Max-Planck Institute for Extraterrestrial Physics (MPE). The development and construction of the eROSITA X-ray instrument was led by MPE, with contributions from the Dr. Karl Remeis Observatory Bamberg & ECAP (FAU Erlangen-Nuernberg), the University of Hamburg Observatory, the Leibniz Institute for Astrophysics Potsdam (AIP), and the Institute for Astronomy and Astrophysics of the University of Tübingen, with the support of DLR and the Max Planck Society. The Argelander Institute for Astronomy of the University of Bonn and the Ludwig Maximilians Universität Munich also participated in the science preparation for eROSITA. The eROSITA data shown here were processed using the eSASS/NRTA software system developed by the German eROSITA consortium. This work is supported by JSPS KAKENHI grant nos. 18J01050 and 19K14759 (Y. Toba), 16K05296 (Y. Terashima), 20H01949 (T. Nagao), and 20H01946 (Y. Ueda).
Appendix A Photometry of WISEJ0909+0002
The multiband photometry of WISEJ0909+0002 is presented in Table A.1. The X-ray flux densities were corrected for galactic and intrinsic absorption, where log(NH∕cm−2) = 20.1 was used forintrinsic absorption correction (see Fig. D.1a). Flux densities in the optical to MIR were corrected for galactic extinction according to Fitzpatrick (1999) and Schlafly & Finkbeiner (2011). The SPIRE FIR flux densities were corrected for flux boosting (see, e.g., Valiante et al. 2016; Toba et al. 2019b).
Photometry of WISEJ0909+0002.
Appendix B Parameter ranges used in the SED fitting with X-CIGALE
Table B.1 summarizes the parameter ranges used in the SED fitting with X-CIGALE (see Sect. 2.2). Best-fit values (termed as BEST_parametername in the output file from X-CIGALE) are denoted by boldface. Here, we briefly explain each parameter for the SED fitting.
Parameter ranges used in the SED fitting with X-CIGALE.
We assumed a delayed SFH with recent starburst (Ciesla et al. 2017) with the parameterizing e-folding time of the main stellar population model (τmain), the age of the main stellar population in the galaxy, the age of the burst, and the ratio of the SFR after and before the burst (R_sfr). A starburst attenuation curve (Calzetti et al. 2000; Leitherer et al. 2002) was used for the dust attenuation, in which we parameterized the color excess of the nebular emission lines ( ). We chose the SSP model (Bruzual & Charlot 2003), assuming the IMF of Chabrier (2003), and the standard nebular emission model included in X-CIGALE (see Inoue 2011). AGN emission was modeled using SKIRTOR (Stalevski et al. 2016). This torus model consists of seven parameters: the torus optical depth at 9.7 μm (τ9.7), the torus density radial parameter (p), the torus density angular parameter (q), the angle between the equatorial plane and the edge of the torus (Δ), the ratio of the maximum to minimum radii of the torus (Rmax∕Rmin), the viewing angle (θ), and the AGN fraction of the total IR luminosity (fAGN). We modeled the dust grain emission using the model from Draine et al. (2014), in which we parameterized the mass fraction of polycyclic aromatic hydrocarbons (PAHs) (qPAH), the minimum radiation field (Umin), the power-law slope of the radiation field distribution (α), and the fraction illuminated with a variable radiation field ranging from Umin to Umax (γ). X-ray emission was modeled with fixed power-law photon indices of AGN, low-mass X-ray binaries (LMXBs), and high-mass X-ray binaries (HMXBs).
Appendix C Possibility of a gravitationally lensed source
We briefly considered the possibility that the LIR of WISEJ0909+0002 is boosted by gravitational lensing12. WISEJ0909+0002 was observed by an optical instrument called the Space Telescope Imaging Spectrograph (STIS), with 50CCD modes (with a pixel scale of ~0.′′05) and a central wavelength of 5903 Å, on board HST (proposal ID = 8202)13. However, we could not find any features of strong lensing (see Fig. C.1), indicating that the LIR for WISEJ0909+0002 is intrinsic and not boosted by lensing.
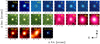 |
Fig. C.1 Multiwavelength images (far-UV, near-UV, 50CCD/HST, u, g, r, i, z, Y, J, H, Ks, 3.4, 4.6, 12, 22, 250, 350, and 500 μm, and 0.2–2.3 keV, from top left to bottom right) for WISEJ0909+0002. North is upward, and east is to the left. The RA and Dec arerelative coordinates with respect to the object in the LS8. Yellow circles in the images also correspond to the coordinates of the LS8. |
We note that WISEJ0909+0002 is known as a pair or binary quasar with a companion quasar (SDSS J090923.13+000204.0) at zspec = 1.887 ± 0.001 located ~15′′ from it (Hennawi et al. 2006; Foreman et al. 2009; Tytler et al. 2009, see the point source in the southwest direction in the UV–NIR images of Fig. C.1). The proper co-moving transverse separation of this system is approximately 130 kpc. Since the companion is located at a higher redshift than that of WISEJ0909+0002, it cannot act as a lens.
Furthermore, given the relatively large beam size (~ 30′′) of SPIRE/Herschel, its FIR photometry would be affected by FIR emissions from the companion quasar14. We also find that the other two sources also fall within SPIRE’s beam size, given the limiting magnitude of DECaLS and KiDS (see the optical sources in the northwest direction seen in Fig. C.1). However, the MIR–FIR emissions of WISEJ0909+0002 do not exhibit any offsets or elongations expected from 500 μm. This indicates that the influence of FIR emissions (at least in 250 and 350 μm) from the neighborhood that includes the companion quasar is expected to be small.
We also considered the possibility that the X-ray flux is overestimated due to the contribution from the companion quasar because the extraction radii for the X-ray spectra contain the position of the companion quasar (see Sect. 2.3). We confirm thatthere is no companion quasar in the XMM or eROSITA images. The Chandra image with higher angular resolution also shows that the companion is not clearly visible, where the counts from WISEJ0909+0002 and the companion quasar are 17 and 2, respectively, including the background. This suggests that the X-ray flux of WISEJ0909+0002 is more than 8.5 times brighter than that of the companion quasar. Thus, contamination from the companion quasar of WISEJ0909+0002 in LX is expected to be small.
Appendix D Possible variability of X-ray properties from Chandra to XMM/eROSITA
As displayed in Fig. 2, the Chandra flux is fainter at < 3 keV, consistent with absorption, which would be supported by the BAL feature in its UV-to-optical spectra obtained in 2001–2009 (see Sect. 3.4). Separated by 15 yr, it is possible that the spectral shape changed between the Chandra and the eROSITA observations. We fitted the Chandra data only using the method and model described in Sect. 2.3. We note that we ran the Bayesian method on the unbinned Chandra spectrum. Since there are only 17 counts in total, any binning of the spectrum would cause a loss of information.
The resultant NH and Γ derived from (i) fitting all the data simultaneously with the same model and (ii) fitting only the Chandra spectrum are shown in Figs. D.1a and b, respectively. We calculated the 68% percentile around the median from the posterior distribution. The lower and upper limits respectively correspond to 16% and 84% percentile values of all the randomly sampled points that constitute the posterior distribution. As displayed in Fig. D.1a, the NH distribution is concentrated at the lower boundary, and the lower limit of NH is unconstrained (with a truncated contour). Thus, we obtained the upper limit for NH. The lower limit of NH is still unconstrained, even if we fit only the Chandra data, as shown in Fig. D.1b. However, the NH distribution has a peak at ~1023 cm−2. Meanwhile, the unconstrained lower tail of NH corresponds to a very flat Γ of 0.99. These results indicate that the Chandra spectral shape is harder, possibly due to high NH obscuration.Considering the low number of counts and the potential cross-calibration issue between different facilities, such a spectral variability is not conclusive (see also Sect. 3.3).
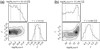 |
Fig. D.1 Posterior distributions of the intrinsic column density and power-law slope for (a) the joint eROSITA-XMM-Chandra fit and (b) the Chandra-only fit, plotted using the “corner” package (Foreman-Mackey 2016). The contour levels correspond to 30%, 60%, and 90% of the distribution. The dashed vertical lines mark the 1σ percentile interval, which is also printed on top of the figure. |
Appendix E X-ray deficit given 6 μm AGN luminosity
It is known from observations that MIR-luminous AGNs tend to deviate from the linear relationship between hard X-ray and MIR luminosities and that they are less X-ray-luminous at a given luminosity, for example 6 μm (L6). This is the so-called X-ray deficit (e.g., Stern 2015; Chen et al. 2017). The X-ray deficit has also been reported for optically luminous quasars (e.g., Vignali et al. 2003; Just et al. 2007). We checked if WISEJ0909+0002 exhibits an X-ray deficit at L6, where L6 = (3.53 ± 0.80) × 1046 erg s−1 is purely from the AGN, estimated by the SED decomposition following Toba et al. (2019a). The expected L2−10 keV based on the nonlinear relations reported by Stern (2015) and Chen et al. (2017) are L2−10 keV ~1.6 and 2.0 × 1045 erg s−1, respectively,which are consistent with the values obtained in this work. This means that WISEJ0909+0002 exhibits an X-ray deficit, as reported in Stern (2015) and Chen et al. (2017).
Toba et al. (2019a) suggested that this X-ray deficit can be explained by a difference in λEdd. The ratio of the 2–10 keV and 6 μm luminosities (LX∕L6) decreases with increasing λEdd, which is interpreted as a change in the structure of the accretion flow (see also, e.g., Chen et al. 2017 and Ishikawa et al. 2021, where other possibilities indicating X-ray deficit are reported). Toba et al. (2019a) reported a linear relationship between LX∕L6 and λEdd for AGNs (see Eq. (3) in Toba et al. 2019a), and this relationship would be appreciable to a Compton-thick AGN (Toba et al. 2020a). Figure E.1 shows λEdd as a function of LX∕L6, where type-1 AGNs selected from the SDSS and WISE (WISSH quasar; Martocchia et al. 2017), XMM-Newton (Mateos et al. 2015), and ROSAT (Toba et al. 2019a) are plotted. A hot, dust-obscured galaxy (hot DOG; Ricci et al. 2017) is also plotted. The best-fit relation based on the above populations as reported in Toba et al. (2019a) is overlaid in Fig. E.1. We find that WISEJ0909+0002 follows the correlation for the observed LX ∕L6 ratio, and the expected λEdd in Toba et al. (2019a) is λEdd ~ 0.4, suggesting that this empirical relation could also be applicable to ELIRGs.
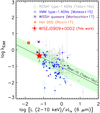 |
Fig. E.1 Eddington ratio (λEdd) as a functionof LX∕L6 of ROSAT type-1 AGNs (gray cross; Toba et al. 2019a), XMM type-1 AGNs (cyan circle; Mateos et al. 2015), a hot DOG (orange square; Ricci et al. 2017), and WISSH quasars (purple asterisk; Martocchia et al. 2017). The red star represents WISEJ0909+0002. The solid green line with the shaded region is a linear relationship between λEdd and LX ∕L6, as reported by Toba et al. (2019a). |
References
- Bakx, T. J. L. C., Eales, S., & Amvrosiadis, A. 2020, MNRAS, 493, 4276 [NASA ADS] [CrossRef] [Google Scholar]
- Bianchi, L. 2011, Ap&SS, 335, 51 [NASA ADS] [CrossRef] [Google Scholar]
- Blecha, L., Snyder, G. F., Satyapal, S., & Ellison, S. L. 2018, MNRAS, 478, 3056 [NASA ADS] [CrossRef] [Google Scholar]
- Bongiorno, A., Merloni, A., Brusa, M., et al. 2012, MNRAS, 427, 3103 [NASA ADS] [CrossRef] [Google Scholar]
- Boquien, M., Buat, V., & Perret, V. 2014, A&A, 571, A72 [NASA ADS] [CrossRef] [EDP Sciences] [Google Scholar]
- Boquien, M., Kennicutt, R., Calzetti, D., et al. 2016, A&A, 591, A6 [NASA ADS] [CrossRef] [EDP Sciences] [Google Scholar]
- Boquien, M., Burgarella, D., Roehlly, Y., et al. 2019, A&A, 622, A103 [NASA ADS] [CrossRef] [EDP Sciences] [Google Scholar]
- Bruzual, G., & Charlot, S. 2003, MNRAS, 344, 1000 [NASA ADS] [CrossRef] [Google Scholar]
- Buat, V., Oi, N., Heinis, S., et al. 2015, A&A, 577, A141 [NASA ADS] [CrossRef] [EDP Sciences] [Google Scholar]
- Buchner J., 2019, PASP, 131, 108005 [Google Scholar]
- Buchner, J., Georgakakis, A., Nandra, K., et al. 2014, A&A, 564, A125 [NASA ADS] [CrossRef] [EDP Sciences] [Google Scholar]
- Burgarella, D., Buat, V., & Iglesias-Páramo, J. 2005, MNRAS, 360, 1413 [Google Scholar]
- Calderone, G., Nicastro, L., Ghisellini, G., et al. 2017, MNRAS, 472, 4051 [NASA ADS] [CrossRef] [Google Scholar]
- Calzetti, D., Armus, L., Bohlin, R. C., et al. 2000, ApJ, 533, 682 [NASA ADS] [CrossRef] [Google Scholar]
- Casey, C. M., Berta, S., Béthermin, M., et al. 2012, ApJ, 761, 139 [NASA ADS] [CrossRef] [Google Scholar]
- Chabrier, G. 2003, PASP, 115, 763 [Google Scholar]
- Chary, R., & Elbaz, D. 2001, ApJ, 556, 562 [Google Scholar]
- Chen, C.-T. J., Hickox, R. C., Goulding, A. D., et al. 2017, ApJ, 837, 145 [NASA ADS] [CrossRef] [Google Scholar]
- Ciesla, L., Elbaz, D., & Fensch, J. 2017, A&A, 608, A41 [NASA ADS] [CrossRef] [EDP Sciences] [Google Scholar]
- Cutri, R. M., Wright, E. L., Conrow, T., et al. 2014, VizieR On-line Data Catalog: II/328 [Google Scholar]
- da Cunha, E., Charlot, S., & Elbaz, D. 2008, MNRAS, 388, 1595 [Google Scholar]
- Dey, A., Schlegel, D. J., Lang, D., et al. 2019, AJ, 157, 168 [NASA ADS] [CrossRef] [Google Scholar]
- Draine, B. T., Aniano, G., Krause, O., et al. 2014, ApJ, 780, 172 [Google Scholar]
- Dullemond, C.P., Juhasz, A., Pohl, A., et al. 2012, Astrophysics Source Code Library [record ascl:1202.015] [Google Scholar]
- Duras, F., Bongiorno, A., & Piconcelli, E. 2017, A&A, 604, A67 [NASA ADS] [CrossRef] [EDP Sciences] [Google Scholar]
- Duras, F., Bongiorno, A., Ricci, F., et al. 2020, A&A, 636, A73 [CrossRef] [EDP Sciences] [Google Scholar]
- Fitzpatrick, E.L. 1999, PASP, 111, 63 [NASA ADS] [CrossRef] [Google Scholar]
- Fleuren, S., Sutherland, W., Dunne, L., et al. 2012, MNRAS, 423, 2407 [NASA ADS] [CrossRef] [Google Scholar]
- Foreman, G., Volonteri, M., & Dotti, M. 2009, ApJ, 693, 1554 [NASA ADS] [CrossRef] [Google Scholar]
- Foreman-Mackey, D. 2016, J. Open Source Softw., 1, 24 [Google Scholar]
- Ganguly, R., Brotherton, M. S., Cales, S., et al. 2007, ApJ, 665, 990 [NASA ADS] [CrossRef] [Google Scholar]
- Gehrels N., 1986, ApJ, 303, 336 [NASA ADS] [CrossRef] [Google Scholar]
- Glikman, E., Rusu, C. E., Djorgovski, S. G., et al. 2018, ApJ, submitted [arXiv:1807.05434] [Google Scholar]
- González-Nuevo, J., Lapi, A., Fleuren, S., et al. 2012, ApJ, 749, 65 [NASA ADS] [CrossRef] [Google Scholar]
- González-Nuevo, J., Suárez Gómez, S. L., Bonavera, L., et al. 2019, A&A, 627, A31 [CrossRef] [EDP Sciences] [Google Scholar]
- Hamann, F., Kanekar, N., Prochaska, J. X., et al. 2011, MNRAS, 410, 1957 [NASA ADS] [Google Scholar]
- Hamann, F., Chartas, G., Reeves, J., et al. 2018, MNRAS, 476, 943 [NASA ADS] [CrossRef] [Google Scholar]
- Hennawi, J. F., Strauss, M. A., Oguri, M., et al. 2006, AJ, 131, 1 [NASA ADS] [CrossRef] [Google Scholar]
- Hopkins, P. F., Hernquist, L., Cox, T. J., & Kereš, D. 2008, ApJS, 175, 356 [NASA ADS] [CrossRef] [Google Scholar]
- Inada, N., Oguri, M., Shin, M.-S., et al. 2012, AJ, 143, 119 [NASA ADS] [CrossRef] [Google Scholar]
- Inoue, A. K. 2011, MNRAS, 415, 2920 [NASA ADS] [CrossRef] [Google Scholar]
- Ishikawa, Y., Goulding, A. D., Zakamska, N. L., et al. 2021, MNRAS, 502, 3769 [Google Scholar]
- Just, D., Brandt, W., Shemmer, O., et al. 2007, ApJ, 665, 1004 [Google Scholar]
- Krawczyk, C. M., Richards, G. T., Mehta, S. S., et al. 2013, ApJS, 206, 4 [NASA ADS] [CrossRef] [Google Scholar]
- Kuijken, K., Heymans, C., Dvornik, A., et al. 2019, A&A, 625, A2 [NASA ADS] [CrossRef] [EDP Sciences] [Google Scholar]
- Lang, D. 2014, AJ, 147, 108, [NASA ADS] [CrossRef] [Google Scholar]
- Lang, D., Hogg, D. W., & Schlegel, D. J. 2016, AJ, 151, 36 [NASA ADS] [CrossRef] [Google Scholar]
- Leipski, C., Meisenheimer, K., Walter, F., et al. 2014, ApJ, 785, 154 [NASA ADS] [CrossRef] [Google Scholar]
- Leitherer, C., Li, I.-H., Calzetti, D., & Heckman, T. M. 2002, ApJS, 140, 303 [NASA ADS] [CrossRef] [Google Scholar]
- Lo Faro, B., Buat, V., Roehlly, Y., et al. 2017, MNRAS, 472, 1372 [Google Scholar]
- Lusso, E., Comastri, A., Vignali, C., et al. 2010, A&A, 512, A34 [NASA ADS] [CrossRef] [EDP Sciences] [Google Scholar]
- Lusso, E., Comastri, A., Simmons, B. D., et al. 2012, MNRAS, 425, 623 [Google Scholar]
- Martin, D. C., Fanson, J., Schiminovich, D., et al. 2005, ApJ, 619, L1 [Google Scholar]
- Martocchia, S., Piconcelli, E., Zappacosta, L., et al. 2017, A&A, 608, A51 [NASA ADS] [CrossRef] [EDP Sciences] [Google Scholar]
- Mateos, S., Carrera, F. J., Alonso-Herrero, A., et al. 2015, MNRAS, 449, 1422 [Google Scholar]
- Matsuoka, K., Toba, Y., Shidatsu, M., et al. 2018, A&A, 620, L3 [EDP Sciences] [Google Scholar]
- Merloni, A., Bongiorno, A., Bolzonella, M., et al. 2010, ApJ, 708, 137 [NASA ADS] [CrossRef] [Google Scholar]
- Merloni, A., Predehl, P., Becker, W., et al. 2012, ArXiv e-prints [arXiv:1209.3114] [Google Scholar]
- Moravec,E. A., Hamann, F., Capellupo, D. M., et al. 2017, MNRAS, 468, 4539 [NASA ADS] [CrossRef] [Google Scholar]
- Narayanan, D., Dey, A., Hayward, C. C., et al. 2010, MNRAS, 407, 1701 [NASA ADS] [CrossRef] [Google Scholar]
- Negrello, M., Hopwood, R., De Zotti, G., et al. 2010, Science, 330, 800 [NASA ADS] [CrossRef] [Google Scholar]
- Negrello, M., Amber, S., Amvrosiadis, A., et al. 2017, MNRAS, 465, 3558 [NASA ADS] [CrossRef] [Google Scholar]
- Nemmen, R. S., & Brotherton, M. S. 2010, MNRAS, 408, 1598 [NASA ADS] [CrossRef] [Google Scholar]
- Noll, S., Burgarella, D., Giovannoli, E., et al. 2009, A&A, 507, 3 [Google Scholar]
- Oguri, M., Inada, N., Pindor, B., et al. 2006, AJ, 132, 999 [NASA ADS] [CrossRef] [Google Scholar]
- Pearson, W. J., Wang, L., Hurley, P. D., et al. 2018, A&A, 615, A146 [NASA ADS] [CrossRef] [EDP Sciences] [Google Scholar]
- Pilbratt, G. L., Riedinger, J. R., Passvogel, T., et al. 2010, A&A, 518, L1 [CrossRef] [EDP Sciences] [Google Scholar]
- Predehl, P., Andritschke, R., Arefiev, V., et al. 2021, A&A, 647, A1 [EDP Sciences] [Google Scholar]
- Rakshit, S., Stalin, C. S., & Kotilainen, J. 2020, ApJS, 249, 17 [CrossRef] [Google Scholar]
- Ricci, C., Assef, R. J., Stern, D., et al. 2017, ApJ, 835, 105 [NASA ADS] [CrossRef] [Google Scholar]
- Rowan-Robinson, M. 2000, MNRAS, 316, 885 [Google Scholar]
- Rowan-Robinson, M., & Wang, L. 2010, MNRAS, 406, 720 [NASA ADS] [Google Scholar]
- Runnoe, J. C., Brotherton, M. S., & Shang, Z. 2012, MNRAS, 422, 478 [NASA ADS] [CrossRef] [Google Scholar]
- Saitoh, T. R., Daisaka, H., Kokubo, E., et al. 2008, PASJ, 60, 667 [NASA ADS] [Google Scholar]
- Saitoh, T. R., Daisaka, H., Kokubo, E., et al. 2009, PASJ, 61, 481 [NASA ADS] [Google Scholar]
- Salvato, M., Buchner, J., Budavári, T., et al. 2018, MNRAS, 473, 4937 [NASA ADS] [CrossRef] [Google Scholar]
- Sanders, D. B., & Mirabel, I. F. 1996, ARA&A, 34, 749 [NASA ADS] [CrossRef] [Google Scholar]
- Schlafly, E. F., & Finkbeiner, D. P. 2011, ApJ, 737, 103 [NASA ADS] [CrossRef] [Google Scholar]
- Stalevski, M., Fritz, J., Baes, M., Nakos, T., & Popović, L. Č. 2012, MNRAS, 420, 2756 [NASA ADS] [CrossRef] [Google Scholar]
- Stalevski M., Ricci C., Ueda, Y., et al. 2016, MNRAS, 458, 2288 [NASA ADS] [CrossRef] [Google Scholar]
- Stern, D. 2015, ApJ, 807, 129 [NASA ADS] [CrossRef] [Google Scholar]
- Symeonidis, M. 2017, MNRAS, 465, 1401 [NASA ADS] [CrossRef] [Google Scholar]
- Symeonidis, M., & Page, M. J. 2018, MNRAS, 479, L91 [NASA ADS] [CrossRef] [Google Scholar]
- Symeonidis, M., Giblin, B. M., Page, M. J., et al. 2016, MNRAS, 459, 257 [NASA ADS] [CrossRef] [Google Scholar]
- Toba, Y., & Nagao, T. 2016, ApJ, 820, 46 [NASA ADS] [CrossRef] [Google Scholar]
- Toba, Y., Nagao, T., Strauss, M. A., et al. 2015, PASJ, 67, 86 [NASA ADS] [CrossRef] [Google Scholar]
- Toba, Y., Bae, H-J., Nagao, T., et al. 2017, ApJ, 850, 140 [NASA ADS] [CrossRef] [Google Scholar]
- Toba Y., Ueda J., Lim, C.-F., et al. 2018, ApJ, 857, 31 [NASA ADS] [CrossRef] [Google Scholar]
- Toba, Y., Ueda, Y., Matsuoka, K., et al. 2019a, MNRAS, 484, 196 [Google Scholar]
- Toba, Y., Yamashita, T., Nagao, T., et al. 2019b, ApJS, 243, 15 [CrossRef] [Google Scholar]
- Toba, Y., Yamada, S., Ueda, Y., et al. 2020a, ApJ, 888, 8 [Google Scholar]
- Toba, Y., Wang, W.-H., Nagao, T., et al. 2020b, ApJ, 889, 76 [Google Scholar]
- Toba, Y., Goto, T., Oi, N., et al. 2020c, ApJ, 899, 35 [Google Scholar]
- Toba, Y., Ueda, Y., Gandhi, P., et al. 2021, ApJ, submitted [arXiv:2102.04620] [Google Scholar]
- Tomczak, A. R., Quadri, R. F., Tran, K.-V. H., et al. 2016, ApJ, 817, 118 [NASA ADS] [CrossRef] [Google Scholar]
- Trump, J. R., Hall, P. B., Reichard, T. A., et al. 2006, ApJS, 165, 1 [NASA ADS] [CrossRef] [Google Scholar]
- Tsai, C.-W., Eisenhardt, P. R. M., Wu, J., et al. 2015, ApJ, 805, 90 [NASA ADS] [CrossRef] [Google Scholar]
- Tytler, D., Gleed, M., Melis, C., et al. 2009, MNRAS, 392, 1539 [NASA ADS] [CrossRef] [Google Scholar]
- Valiante, E., Smith, M. W. L., Eales, S., et al. 2016, MNRAS, 462, 3146 [NASA ADS] [CrossRef] [Google Scholar]
- Vanden Berk, D. E., Richards, G. T., Bauer, A., et al. 2001, AJ, 122, 549 [NASA ADS] [CrossRef] [Google Scholar]
- Vasudevan, R.V., & Fabian, A. C. 2007, MNRAS, 381, 1235 [NASA ADS] [CrossRef] [Google Scholar]
- Vestergaard, M., & Osmer, P. S. 2009, ApJ, 699, 800 [Google Scholar]
- Vignali, C., Brandt, W. N., & Schneider, D. P. 2003, AJ, 125, 433 [NASA ADS] [CrossRef] [Google Scholar]
- Wang, T., Yang, C., Wang, H., & Ferland, G. 2015, ApJ, 814, 150 [Google Scholar]
- Weedman, D., Sargsyan, L., Lebouteiller, V., Houck, J., & Barry, D. 2012, ApJ, 761, 184 [NASA ADS] [CrossRef] [Google Scholar]
- Wright, E. L., Eisenhardt, P. R. M., Mainzer, A. K., et al. 2010, AJ, 140, 1868 [Google Scholar]
- Xu, X., Arav, N., Miller, T., & Benn, C. 2018, ApJ, 858, 39 [NASA ADS] [CrossRef] [Google Scholar]
- Yang, G., Boquien, M., Buat, V., et al. 2020, MNRAS, 491, 740 [NASA ADS] [CrossRef] [Google Scholar]
- York, D. G., Adelman, J., Anderson, J. E., Jr., et al. 2000, AJ, 120, 1579 [CrossRef] [Google Scholar]
Empirically, LIR is defined as the luminosity integrated over a wavelength range of 8–1000 μm (e.g., Sanders & Mirabel 1996; Chary & Elbaz 2001). However, since this definition includes contributions from stellar emissions, we did not adopt any boundary for the integration range on the wavelength. Instead, we employed a physically oriented approach to estimate LIR in this work (see Sect. 3.1).
The corresponding signal-to-noise ratio of the flux density at 22 μm is greater than 5.0. Possible stars and artifacts were removed from the sample.
This software derives source level products from calibrated eROSITA event files and their ancillary metadata. See https://erosita.mpe.mpg.de/eROdoc/tasks/srctool_doc.html for details.
This value is within a dispersion of αopt distribution for SDSS quasars (e.g., Vanden Berk et al. 2001).
Krawczyk et al. (2013) reported L2−10 keV for WISEJ0909+0002 to be log (L2−10 keV∕erg s−1) = 45.45 ± 0.18, which is in good agreement with our work. However, their derivation is based on an empirical relation between 2500 Å and the 2 keV luminosity for a given photon index (Γ = 2).
Rakshit et al. (2020) only decomposed the host galaxy from spectra for quasars at z < 0.8, and thus the contribution from the host galaxy for WISEJ0909+0002 was not taken into account to estimate L3000. But since the host contribution to L3000 for luminous quasars is expected to be negligible, we did not apply for host subtraction (see also Calderone et al. 2017).
If we employ the relationships of κX–λEdd and κX–MBH presented in Duras et al. (2020), the resultant κX values are ~36 and ~ 116, respectively. Although the λEdd-based kX is significantly smaller than what is reported (~200), it would be hard to discuss the origin of this discrepancy here given the huge scatter (0.3–0.4 dex) in those empirical relationships. We note that the κX –λEdd and κX –MBH relations in Duras et al. (2020) are based not only on type-1 but also on type-2 AGNs, although the kX –Lbol relation is derived only from type-1 AGNs, which might induce the discrepancy.
We are not able to rule out the possibility that the X-ray absorber and BAL gas are not exactly the same, although these absorbers are often reported to have similar properties (e.g., velocity and column density) and are likely to be the same for some quasars (Hamann et al. 2018). A detailed analysis of the X-ray absorption line is required to address this issue, which may be the scope of future work.
Yutani et al. conducted high-resolution N-body and smoothed particle hydrodynamics (SPH) simulations with ASURA (Saitoh et al. 2008, 2009) and investigated the time evolution of the SED of mergers using the radiative transfer simulation code RADMC-3D (Dullemond et al. 2012).
For example, Glikman et al. (2018) reported an ELIRG (WISE J104222.11+164115.3) to be a quadruply lensed system with a magnification factor of 53–122 (see also Matsuoka et al. 2018).
Although the aim of this program was to identify lenses with component image separations < 1′′, WISEJ0909+0002 has not been selected as a lensed system candidate by other lens searches, such as H-ATLAS sources (e.g., Negrello et al. 2010, 2017; González-Nuevo et al. 2012, 2019; Bakx et al. 2020, and references therein) or SDSS quasars (e.g., Oguri et al. 2006; Inada et al. 2012, and reference therein).
The companion quasar was not detected by ALLWISE (Cutri et al. 2014) 12 or 22 μm, but it was detected by unWISE 3.4 and 4.6 μm with flux densities of 51 ± 3 and 61 ± 5μJy, respectively.
All Tables
All Figures
|
Fig. 1 Best-fit SED of WISEJ0909+0002. The black points are photometric data, and the solid gray line represents the resultant best-fit SED. The inset figure shows the SED at 0.1–500 μm, where the contributions from the stellar, nebular, AGN, and SF components to the total SED are shown as blue, green, yellow, and red lines, respectively. The relative residual (defined as (data – best-fit)/data) are shown at the bottom, where the black line represents the case in which the residual is zero. |
| In the text | |
|
Fig. 2 X-ray spectra of eROSITA (blue), EPIC-pn (green), and Chandra (red) folded with the energy responses and fitted with the same model (absorbed power-law). The data are binned to a minimum significance of 2σ
for convenience. The best-fit model and the corresponding 99% confidence interval are displayed in blue, green, and red for eROSITA, EPIC-pn, and Chandra, respectively. The lower panel displays the (data-model)/ |
| In the text | |
|
Fig. C.1 Multiwavelength images (far-UV, near-UV, 50CCD/HST, u, g, r, i, z, Y, J, H, Ks, 3.4, 4.6, 12, 22, 250, 350, and 500 μm, and 0.2–2.3 keV, from top left to bottom right) for WISEJ0909+0002. North is upward, and east is to the left. The RA and Dec arerelative coordinates with respect to the object in the LS8. Yellow circles in the images also correspond to the coordinates of the LS8. |
| In the text | |
|
Fig. D.1 Posterior distributions of the intrinsic column density and power-law slope for (a) the joint eROSITA-XMM-Chandra fit and (b) the Chandra-only fit, plotted using the “corner” package (Foreman-Mackey 2016). The contour levels correspond to 30%, 60%, and 90% of the distribution. The dashed vertical lines mark the 1σ percentile interval, which is also printed on top of the figure. |
| In the text | |
|
Fig. E.1 Eddington ratio (λEdd) as a functionof LX∕L6 of ROSAT type-1 AGNs (gray cross; Toba et al. 2019a), XMM type-1 AGNs (cyan circle; Mateos et al. 2015), a hot DOG (orange square; Ricci et al. 2017), and WISSH quasars (purple asterisk; Martocchia et al. 2017). The red star represents WISEJ0909+0002. The solid green line with the shaded region is a linear relationship between λEdd and LX ∕L6, as reported by Toba et al. (2019a). |
| In the text | |
Current usage metrics show cumulative count of Article Views (full-text article views including HTML views, PDF and ePub downloads, according to the available data) and Abstracts Views on Vision4Press platform.
Data correspond to usage on the plateform after 2015. The current usage metrics is available 48-96 hours after online publication and is updated daily on week days.
Initial download of the metrics may take a while.