Fig. 1
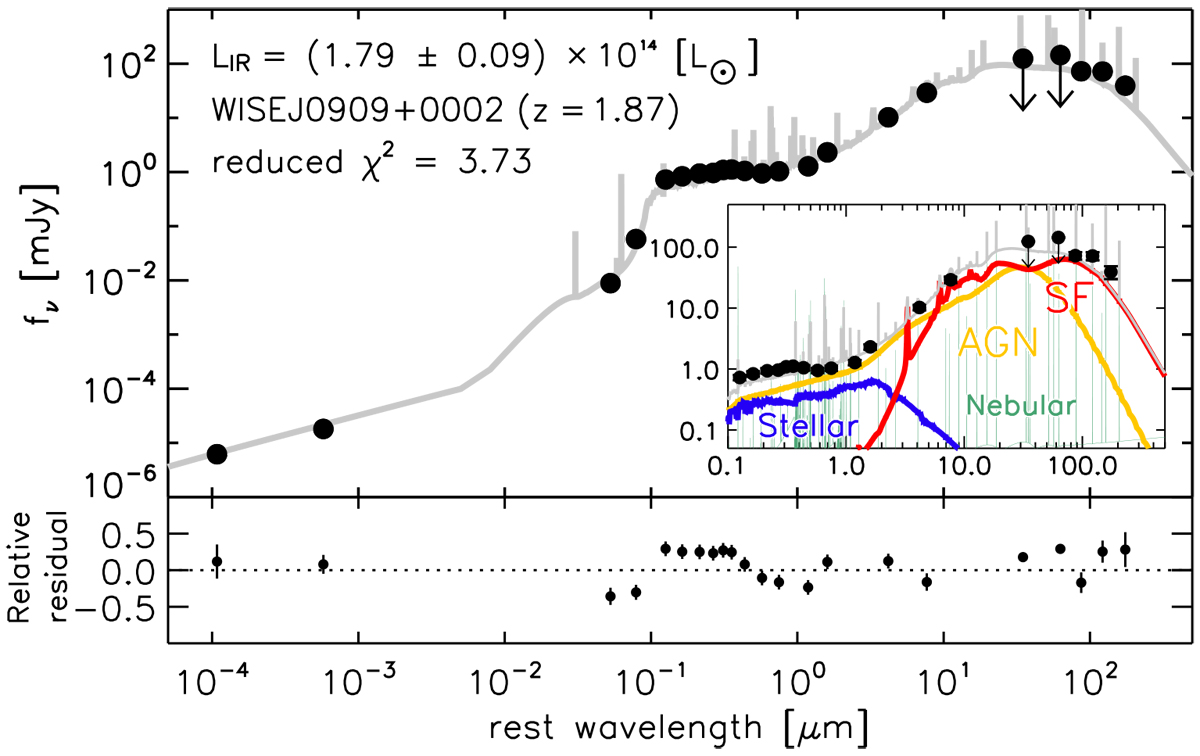
Best-fit SED of WISEJ0909+0002. The black points are photometric data, and the solid gray line represents the resultant best-fit SED. The inset figure shows the SED at 0.1–500 μm, where the contributions from the stellar, nebular, AGN, and SF components to the total SED are shown as blue, green, yellow, and red lines, respectively. The relative residual (defined as (data – best-fit)/data) are shown at the bottom, where the black line represents the case in which the residual is zero.
Current usage metrics show cumulative count of Article Views (full-text article views including HTML views, PDF and ePub downloads, according to the available data) and Abstracts Views on Vision4Press platform.
Data correspond to usage on the plateform after 2015. The current usage metrics is available 48-96 hours after online publication and is updated daily on week days.
Initial download of the metrics may take a while.