Fig. 8.
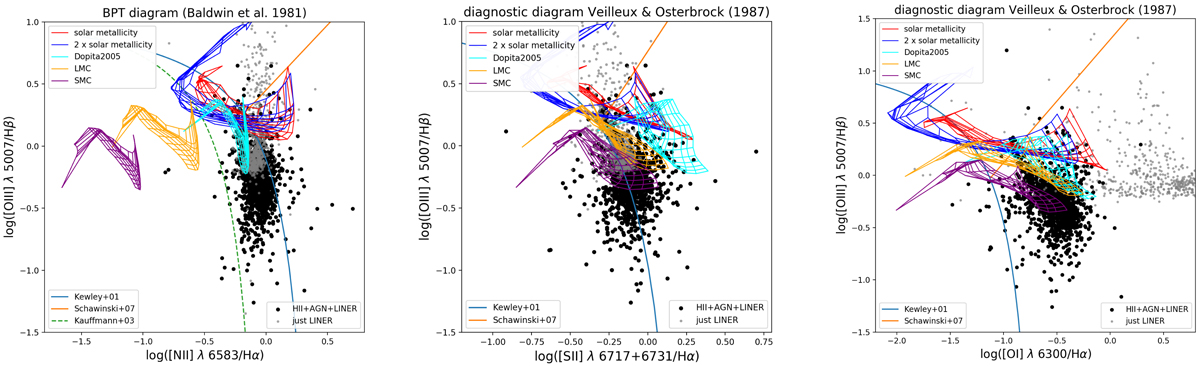
Same as Fig. 7, but showing in addition the predictions from the fully radiative shock models of Allen et al. (2008) computed with MAPPINGS V. We consider a pre-shock density of 1 cm−3, shock velocities ranging from 10 to 350 km s−1, and different metallicities. The choice of these shock velocities are motivated by the observed velocity dispersion of the nebular gas. The red lines depict a grid with solar metallicity, the blue ones a grid with twice solar metallicity, the cyan lines one with metallicities from Dopita et al. (2005), the orange ones a grid with Large Magellanic Cloud metallicities, and the purple ones a grid with Small Magellanic Cloud metallicities. The black data-points represent the spaxels of the MUSE cube, with an S/N > 10 in each emission line used for the diagnostic. The grey data-points represent the spaxels of the MUSE cube, from which we have subtracted the contribution from star formation and AGN emission to the total luminosity of each emission line, after applying the decomposition method of Davies et al. (2017). These data-points are representative for pure LINER-like emission.
Current usage metrics show cumulative count of Article Views (full-text article views including HTML views, PDF and ePub downloads, according to the available data) and Abstracts Views on Vision4Press platform.
Data correspond to usage on the plateform after 2015. The current usage metrics is available 48-96 hours after online publication and is updated daily on week days.
Initial download of the metrics may take a while.