Fig. 6.
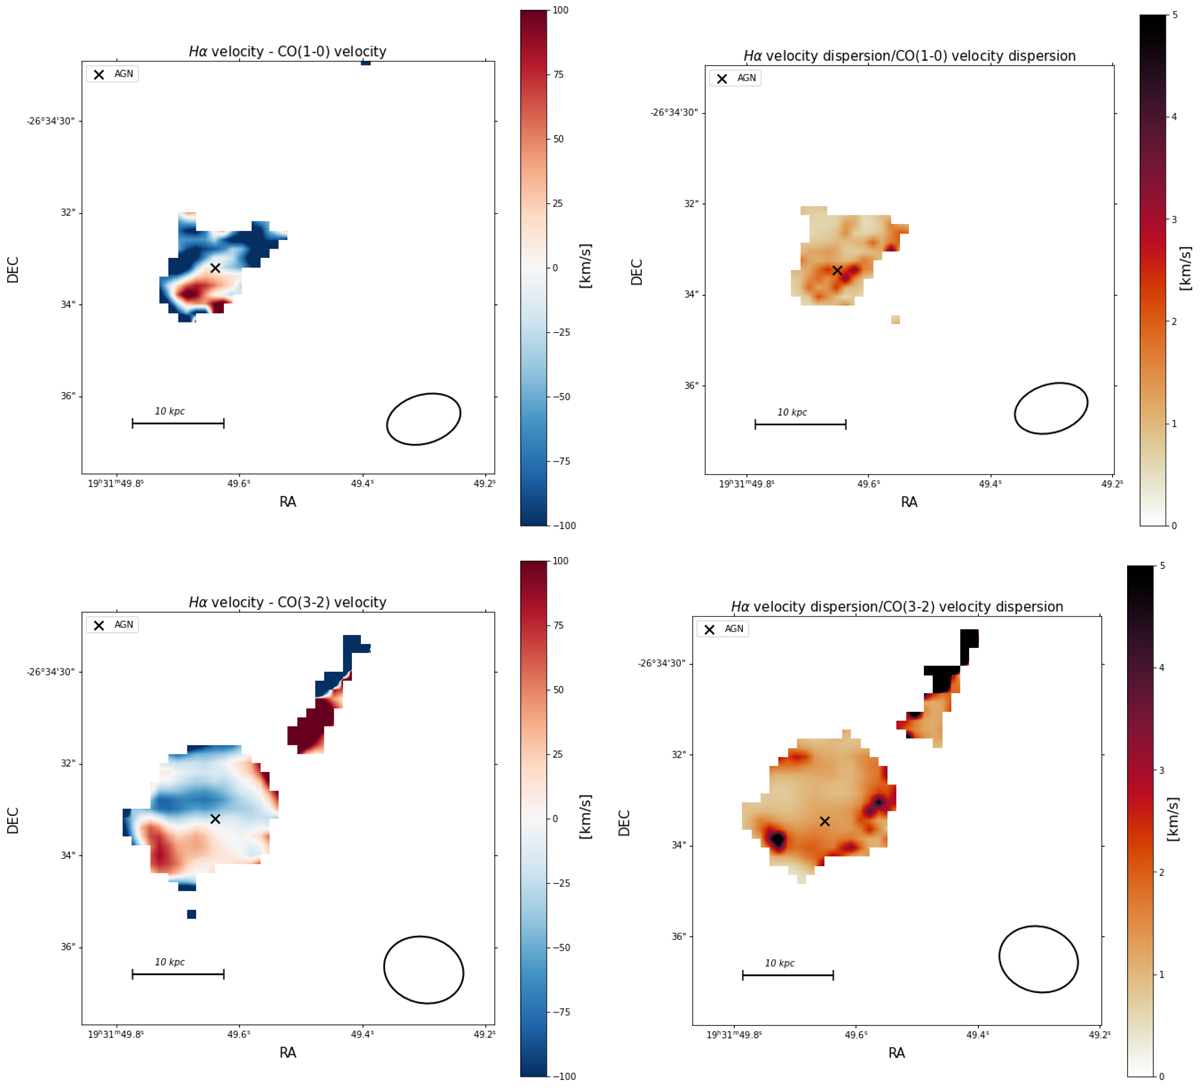
Difference between the kinematics of the ionised gas and those of the cold molecular gas. For a better visualisation, we present the zoomed in plots corresponding to a spatial scale of 45 by 45 kpc. Left side: difference between the radial velocity of the Hα gas and the velocity of the CO(1-0) gas (top) and difference between the velocity of the Hα gas and the velocity of the CO(3-2) gas (bottom). Right side: ratio between the Hα velocity dispersion and the CO(1-0) velocity dispersion (top) and ratio between the velocity dispersion of the Hα gas and the velocity dispersion of the CO(3-2) gas (bottom). The cross in all diagrams shows the location of the AGN, as identified according to the different diagnostic diagrams. The ellipses in the lower right of all panels depict the beam sizes of the ALMA observations.
Current usage metrics show cumulative count of Article Views (full-text article views including HTML views, PDF and ePub downloads, according to the available data) and Abstracts Views on Vision4Press platform.
Data correspond to usage on the plateform after 2015. The current usage metrics is available 48-96 hours after online publication and is updated daily on week days.
Initial download of the metrics may take a while.