Fig. 2.
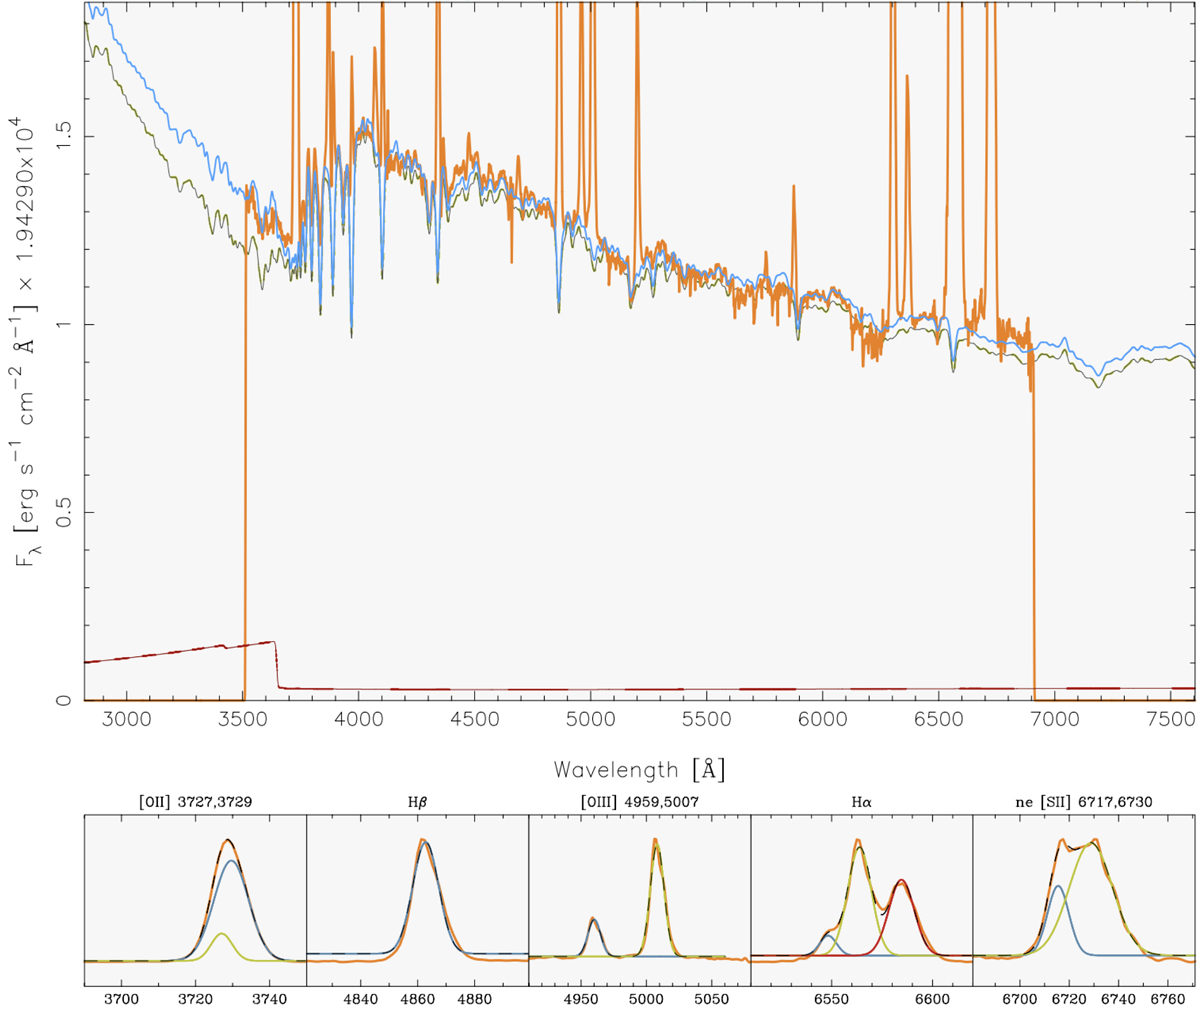
Graphical output of FADO. Upper panel: integrated spectrum of the M1931 BCG orange, as recovered from MUSE. The best-fitting synthetic SED is shown in light-blue, composed of the stellar and nebular continuum emission (dark green and red, respectively). Lower panel: fits to the strongest emission lines, namely, [O II] λ3727, λ3729, Hβ, [O III] λ4959, 5007, Hα, [N II] λ6584, and [S II] λ6718, 6732.
Current usage metrics show cumulative count of Article Views (full-text article views including HTML views, PDF and ePub downloads, according to the available data) and Abstracts Views on Vision4Press platform.
Data correspond to usage on the plateform after 2015. The current usage metrics is available 48-96 hours after online publication and is updated daily on week days.
Initial download of the metrics may take a while.