Fig. 15.
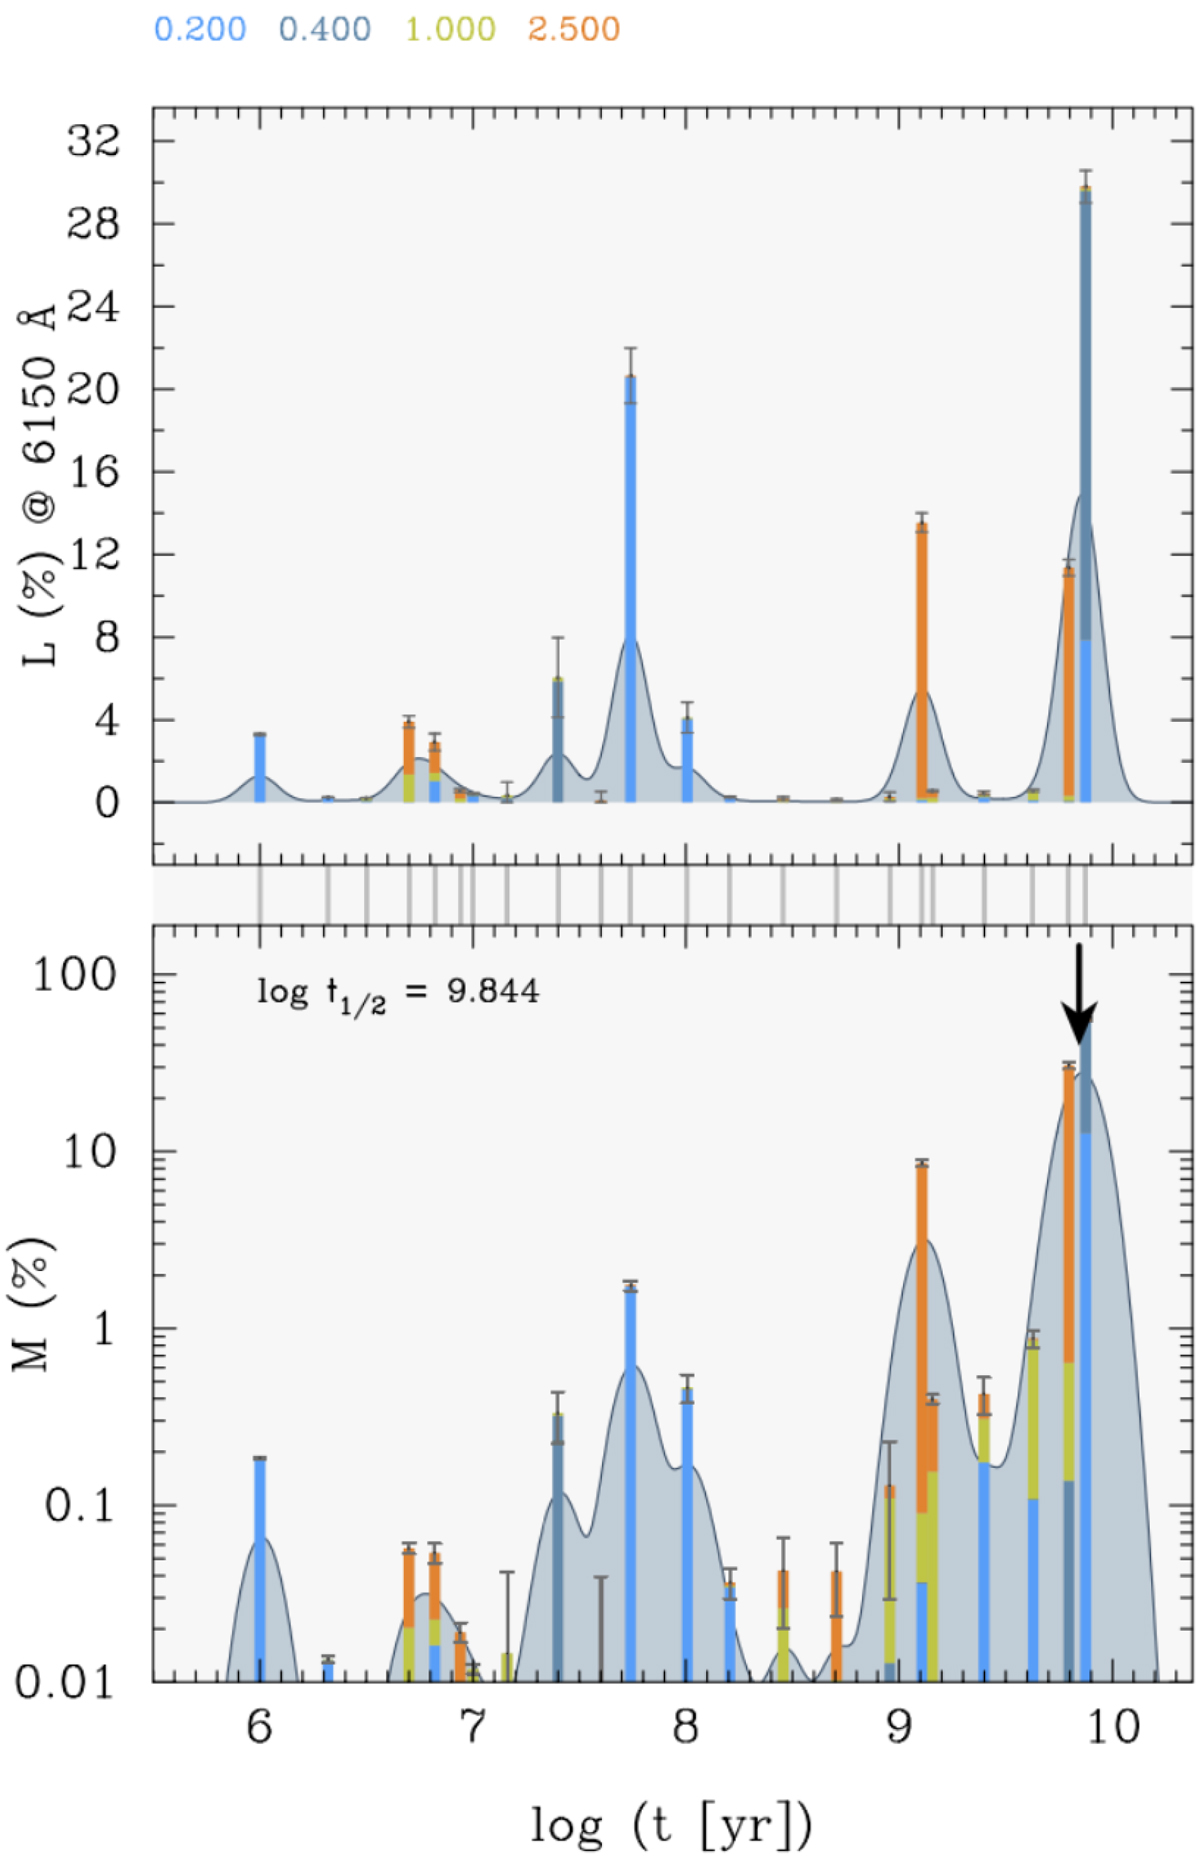
Star formation history of the M1931 BCG. Upper panel: contribution of the individual SSPs in the best-fitting population vector to the monochromatic luminosity at 6150 Å as a function of age. Lower panel: contribution of the SSPs to the total mass of the system as a function of age. The vertical arrow marks the age when 50% of the present-day stellar mass has been in place. The colour coding in both panels display the metallicities of the SSPs, whose values can be found above the upper plot. The vertical bars represent the 1σ uncertainties. The grey vertical lines connecting the two panels mark the ages of the SSPs. The light-blue shaded area in both panels shows an Akima-smoothed (Akima 1970) version of the SSP contributions.
Current usage metrics show cumulative count of Article Views (full-text article views including HTML views, PDF and ePub downloads, according to the available data) and Abstracts Views on Vision4Press platform.
Data correspond to usage on the plateform after 2015. The current usage metrics is available 48-96 hours after online publication and is updated daily on week days.
Initial download of the metrics may take a while.