Fig. 11.
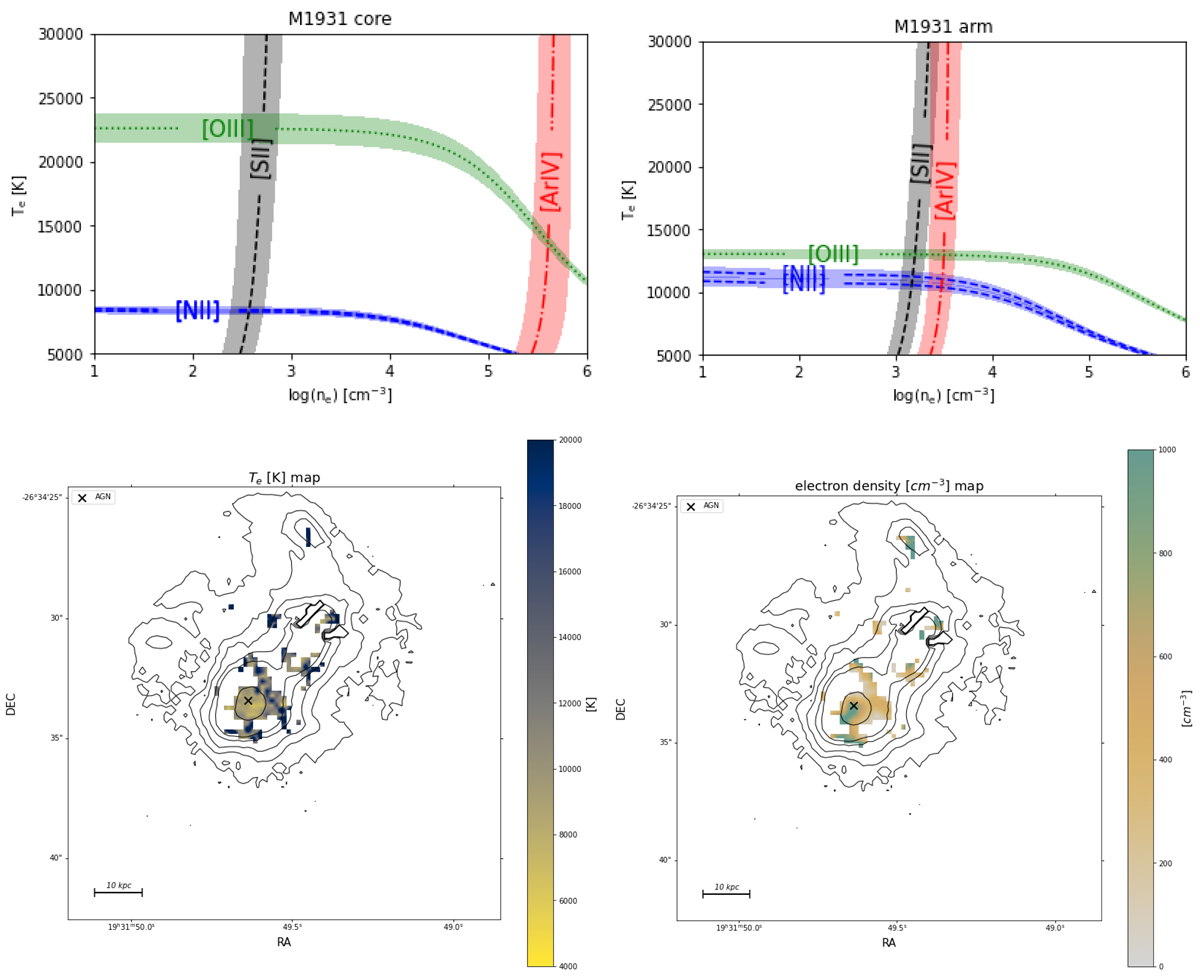
Top-left: electron density vs electron temperature diagnostic diagram for the core of the M1931 BCG. For this plot, we use the following diagnostics: [N II] λ 5755/6548, [N II] λ 5755/6584, [S II] λ 6731/6716, [Ar IV] λ 4740/4711, and [O III] λ 4363/5007. The intersection of the curves gives the best fit electron temperature and density. Top-right: same as top-left, but for the Hα tail of the BCG. Bottom-left: spatially resolved electron temperature map for the BCG of the M1931 cluster. The colour bar shows the temperature measured in [K], as computed using the PyNeb tool, from the [N II] λ5755/6584 emission lines. Bottom-right: electron density map as computed using the PyNeb tool, from the [S II] λ6731/6716 doublet. The colour-bar depicts the density in units of cm−3. The contours in both lower panels show the Hα flux intensity, while the cross shows the location of the AGN.
Current usage metrics show cumulative count of Article Views (full-text article views including HTML views, PDF and ePub downloads, according to the available data) and Abstracts Views on Vision4Press platform.
Data correspond to usage on the plateform after 2015. The current usage metrics is available 48-96 hours after online publication and is updated daily on week days.
Initial download of the metrics may take a while.