Fig. 10.
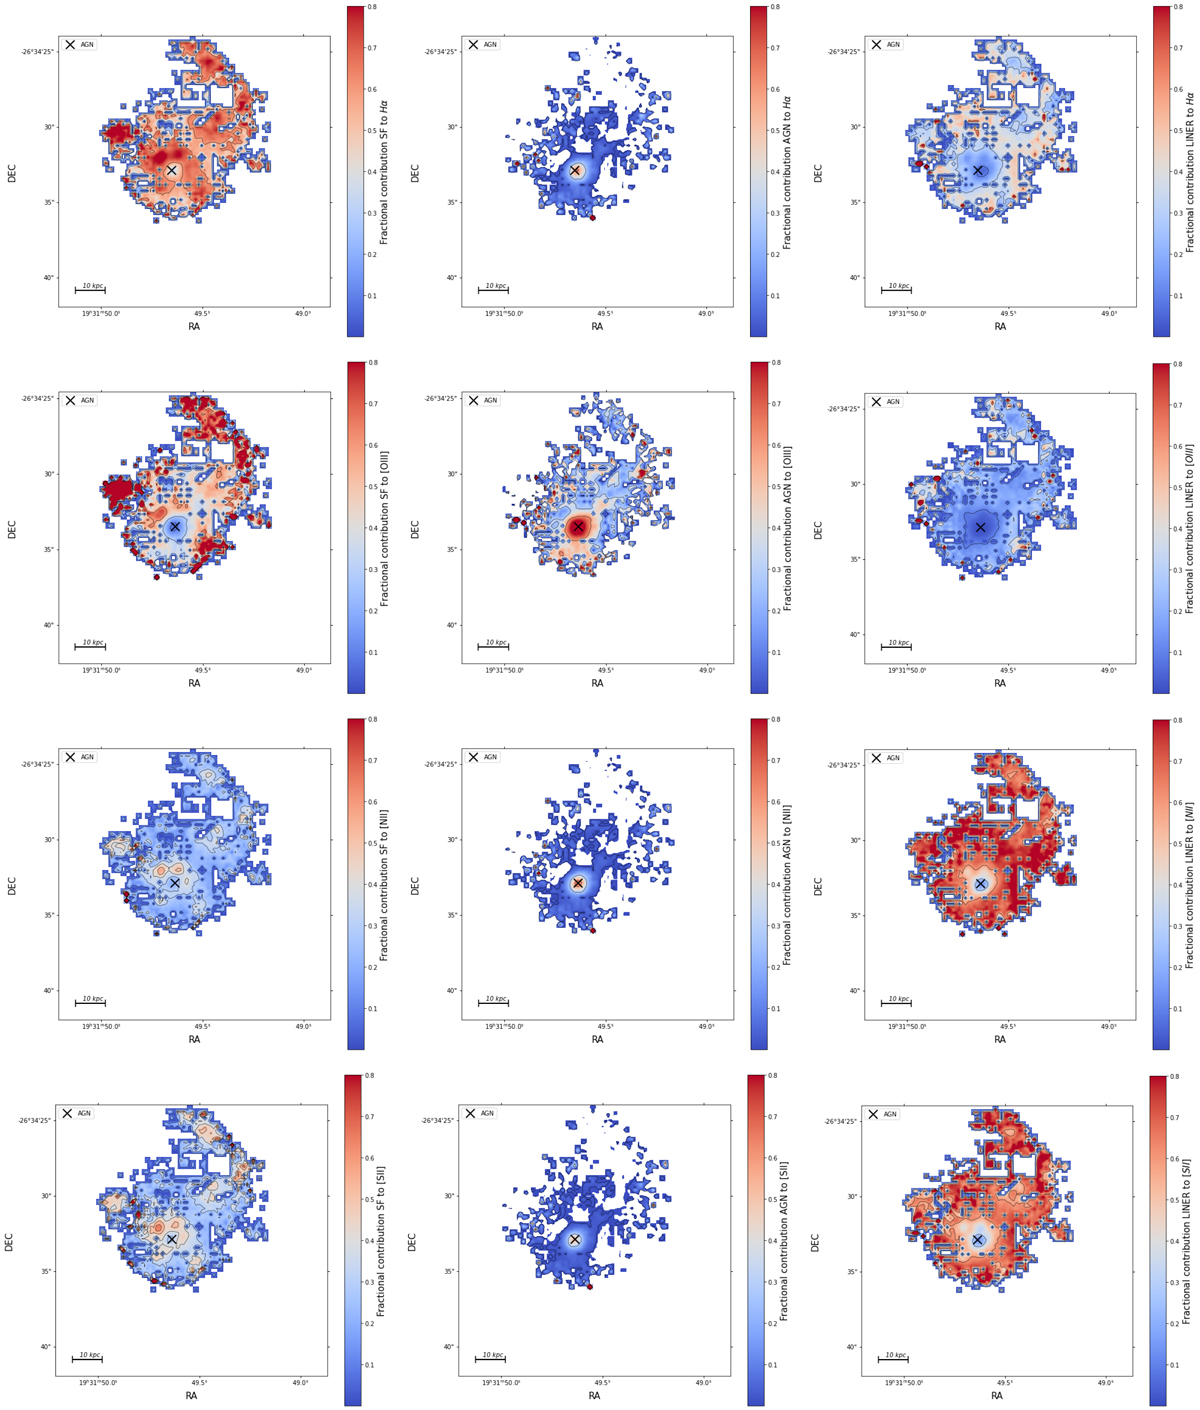
Maps depicting the fractional contribution of SF (left), AGN (middle), ‘LINER’ (right) to the Hα (first row), [O III] λ5007 (second row), [N II] λ6584 (third row) and [S II] (last row) emission lines, as calculated based on the spectral decomposition method. The colour-bar limit displaying the fractional contribution of each ionising mechanism to the total luminosity of the emission lines was set to 0.8, and not the nominal value of 1, for better visualisation purposes. The cross in all diagrams shows the location of the AGN.
Current usage metrics show cumulative count of Article Views (full-text article views including HTML views, PDF and ePub downloads, according to the available data) and Abstracts Views on Vision4Press platform.
Data correspond to usage on the plateform after 2015. The current usage metrics is available 48-96 hours after online publication and is updated daily on week days.
Initial download of the metrics may take a while.