Open Access
Fig. D.1.
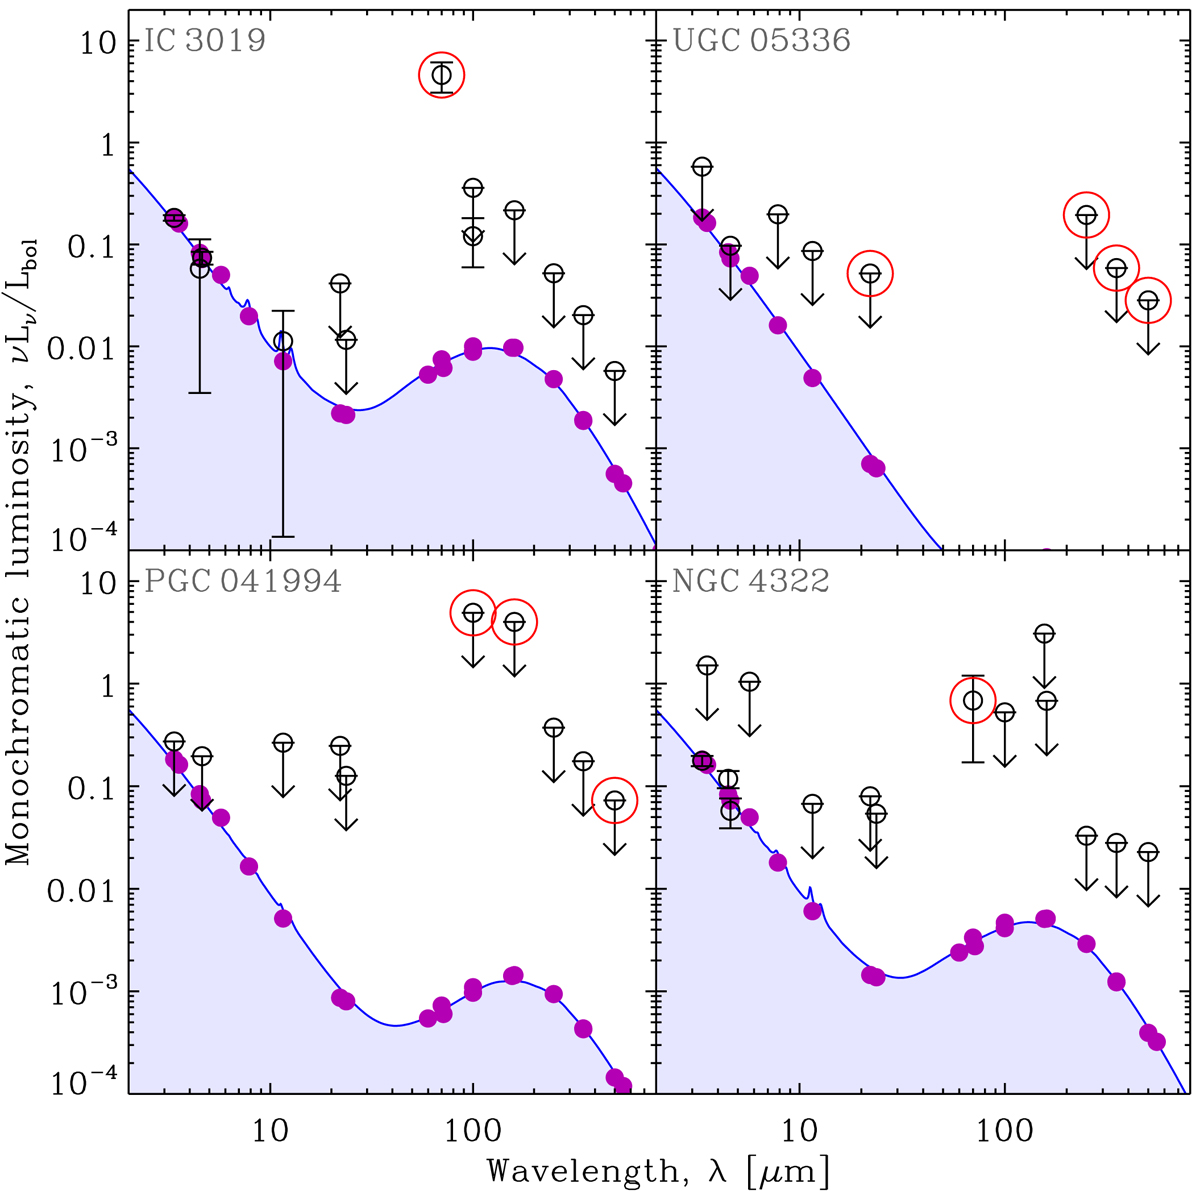
SEDs of the four galaxies causing the maximum deviations of the PPP. The black circles with error bars are the observables. Most of them are upper limits. The blue line is the maximum a posteriori model, and the purple dots are the synthetic photometry. The problematic fluxes are identified by a red circle.
Current usage metrics show cumulative count of Article Views (full-text article views including HTML views, PDF and ePub downloads, according to the available data) and Abstracts Views on Vision4Press platform.
Data correspond to usage on the plateform after 2015. The current usage metrics is available 48-96 hours after online publication and is updated daily on week days.
Initial download of the metrics may take a while.