Fig. 13.
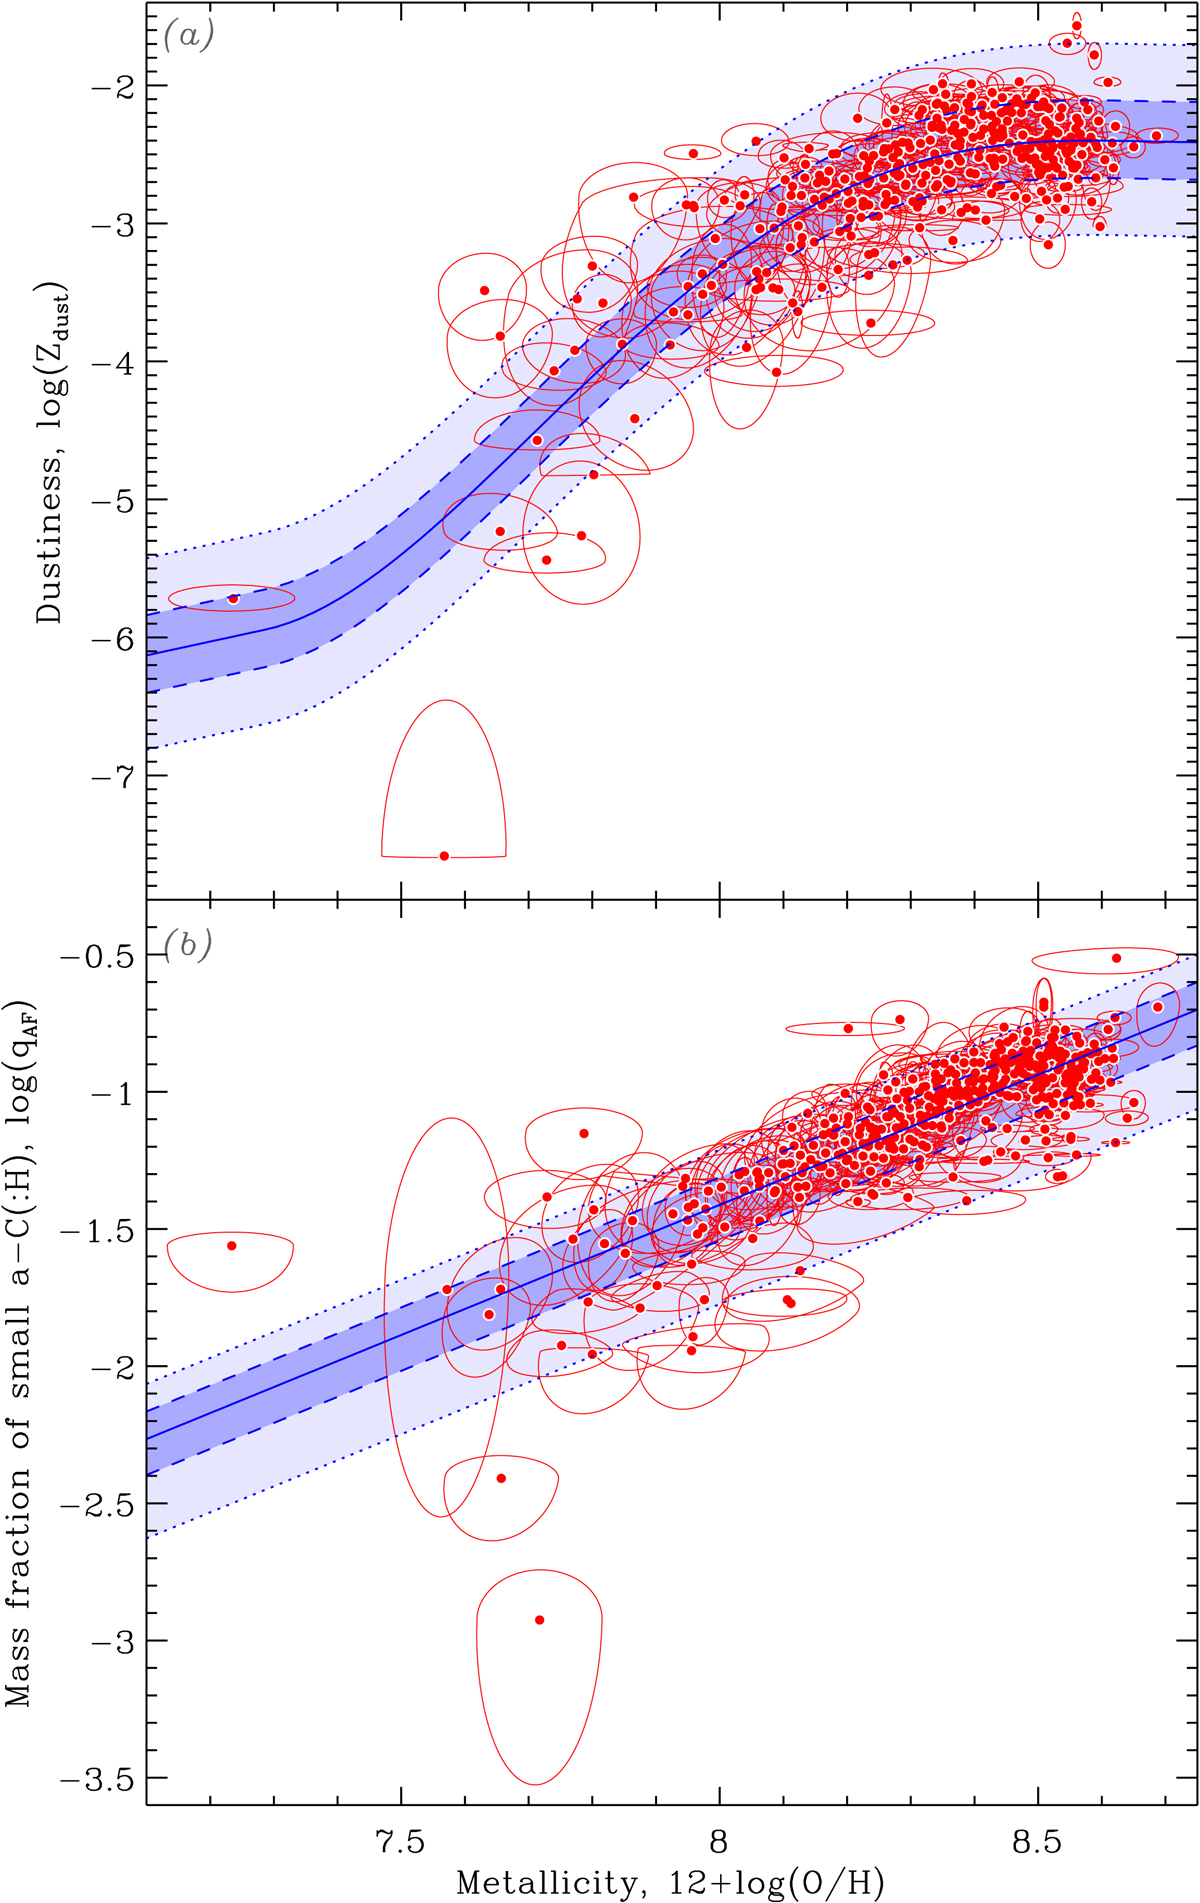
Analytical fit of the scaling relations. The red SUEs show the data of panel d of Fig. 8 and panel b of Fig. 12. The blue curve in panel a shows the analytical fit of Eq. (8) modified by Eq. (9). The blue curve in panel b shows the analytical fit of Eq. (10). In both panels, the dashed lines display the envelope encompassing 68% of the sources, and the dotted lines, the envelope encompassing 95% of the sources. We show here the decimal logarithm of the Zdust and qAF.
Current usage metrics show cumulative count of Article Views (full-text article views including HTML views, PDF and ePub downloads, according to the available data) and Abstracts Views on Vision4Press platform.
Data correspond to usage on the plateform after 2015. The current usage metrics is available 48-96 hours after online publication and is updated daily on week days.
Initial download of the metrics may take a while.