Fig. 5.
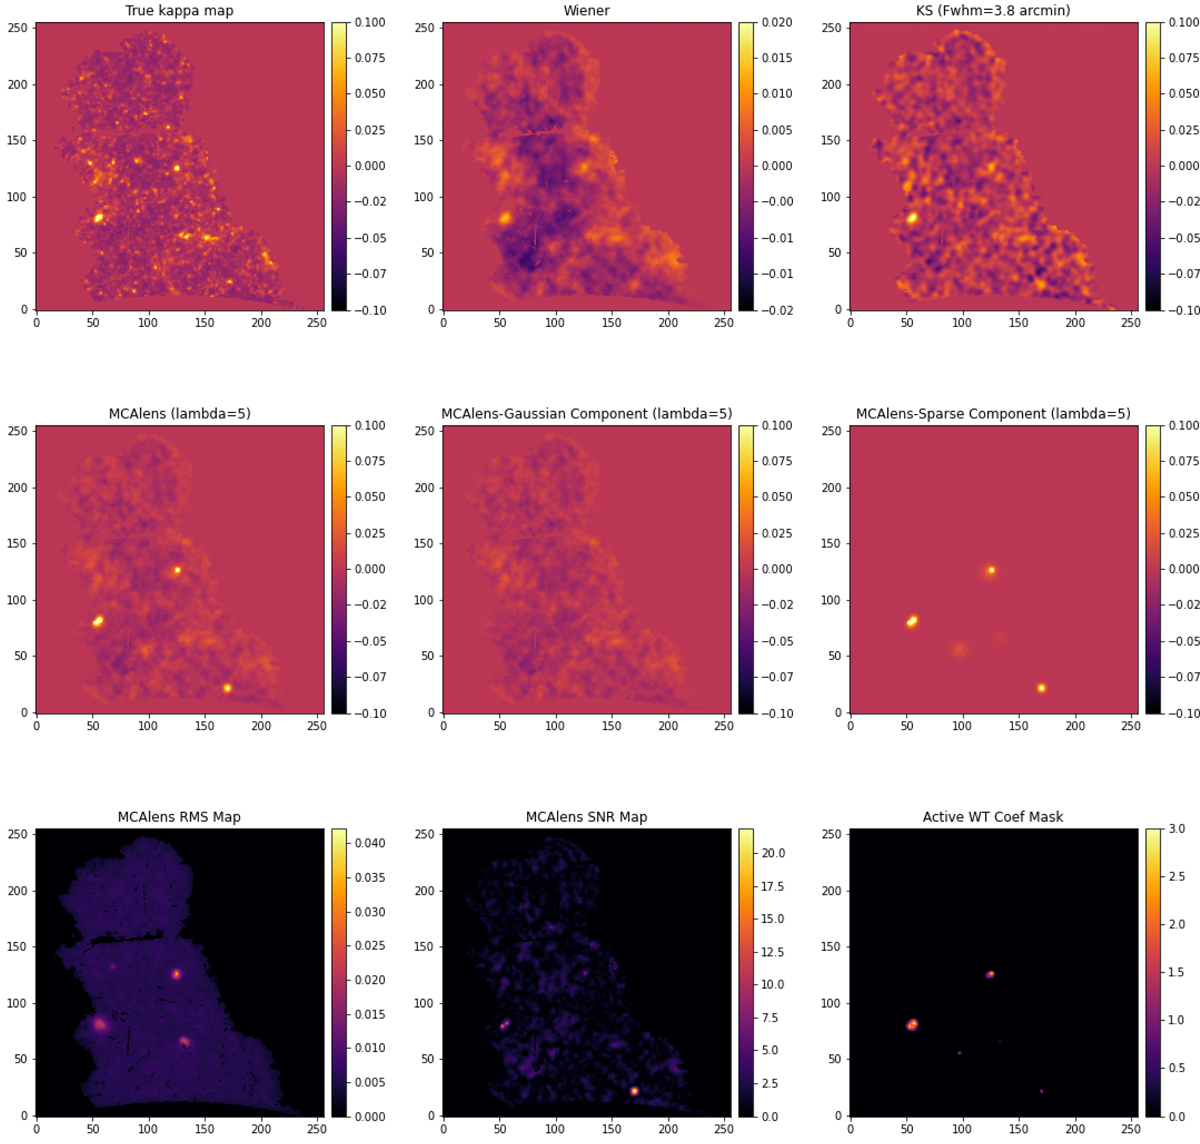
Columbia convergence map recovery. Top panel: a true convergence map, a Wiener-filter map, and a Kaiser-Squires map smoothed with a Gaussian with an FWHM of 3.8 arcmin. Middle panel: MCAlens map and its Gaussian and sparse components. The sum of these two last maps is equal to the first map. Bottom panel: RMS, S/N, and significance maps.
Current usage metrics show cumulative count of Article Views (full-text article views including HTML views, PDF and ePub downloads, according to the available data) and Abstracts Views on Vision4Press platform.
Data correspond to usage on the plateform after 2015. The current usage metrics is available 48-96 hours after online publication and is updated daily on week days.
Initial download of the metrics may take a while.