Fig. 9.
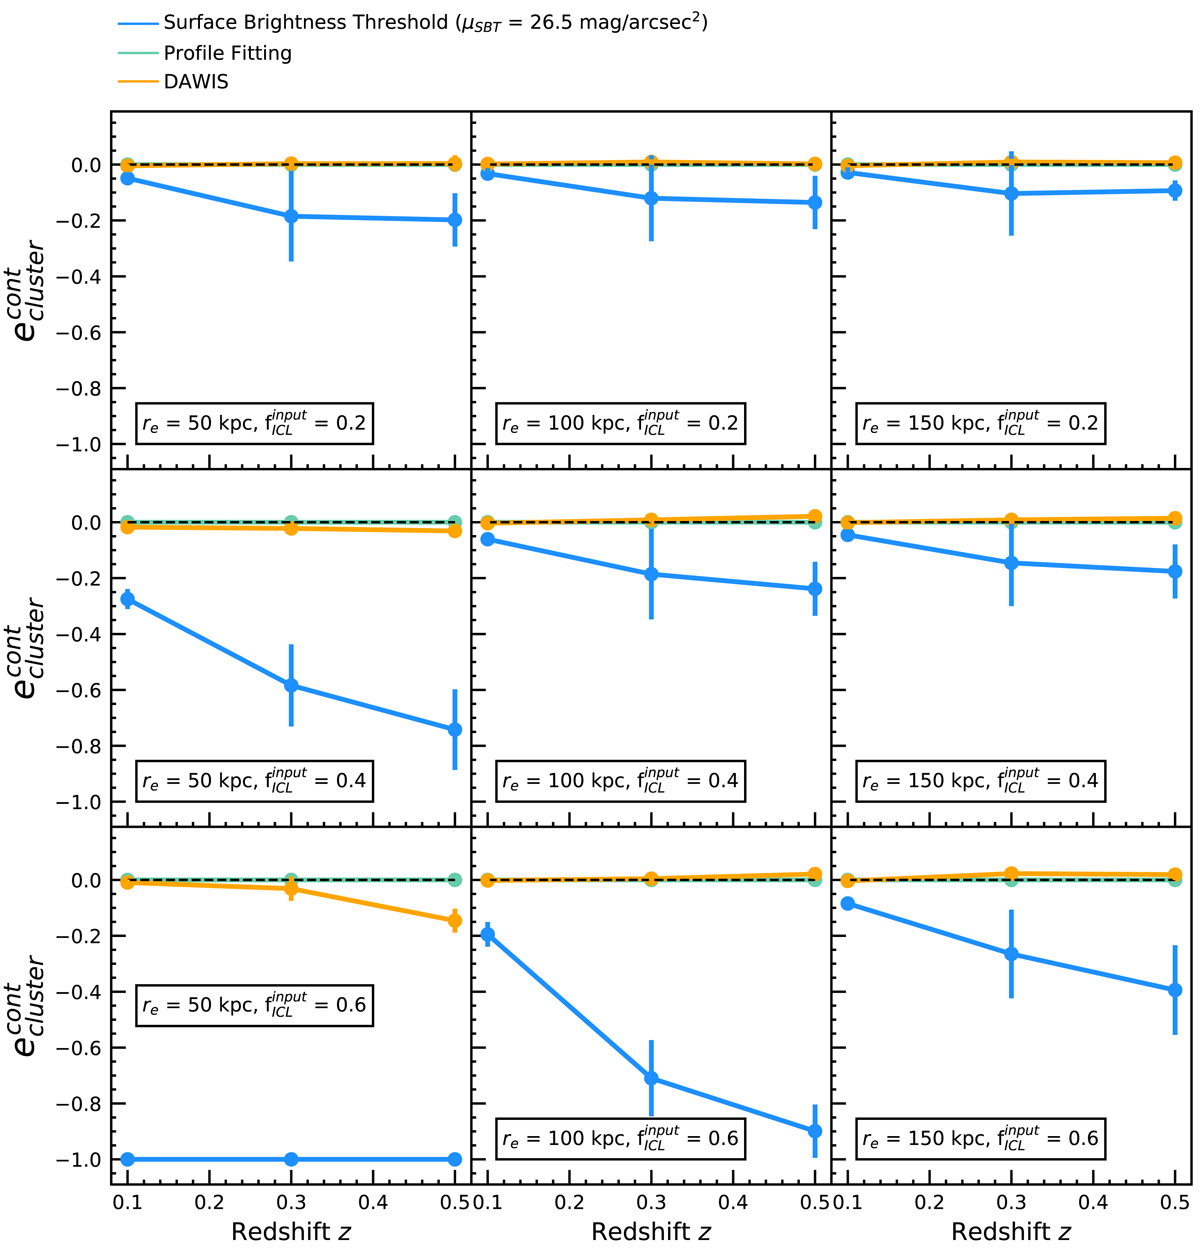
Relative biases ![]() (see Eq. (15) in the text) given by the different detection methods and displayed against redshift z. They have been computed for each of the 270 GAL+ICL+NOISE MegaCam-type images, and the displayed values correspond to the average of the ten images at the same redshift. The error bars correspond to standard deviations in ten different clusters.
(see Eq. (15) in the text) given by the different detection methods and displayed against redshift z. They have been computed for each of the 270 GAL+ICL+NOISE MegaCam-type images, and the displayed values correspond to the average of the ten images at the same redshift. The error bars correspond to standard deviations in ten different clusters.
Current usage metrics show cumulative count of Article Views (full-text article views including HTML views, PDF and ePub downloads, according to the available data) and Abstracts Views on Vision4Press platform.
Data correspond to usage on the plateform after 2015. The current usage metrics is available 48-96 hours after online publication and is updated daily on week days.
Initial download of the metrics may take a while.