Fig. 10.
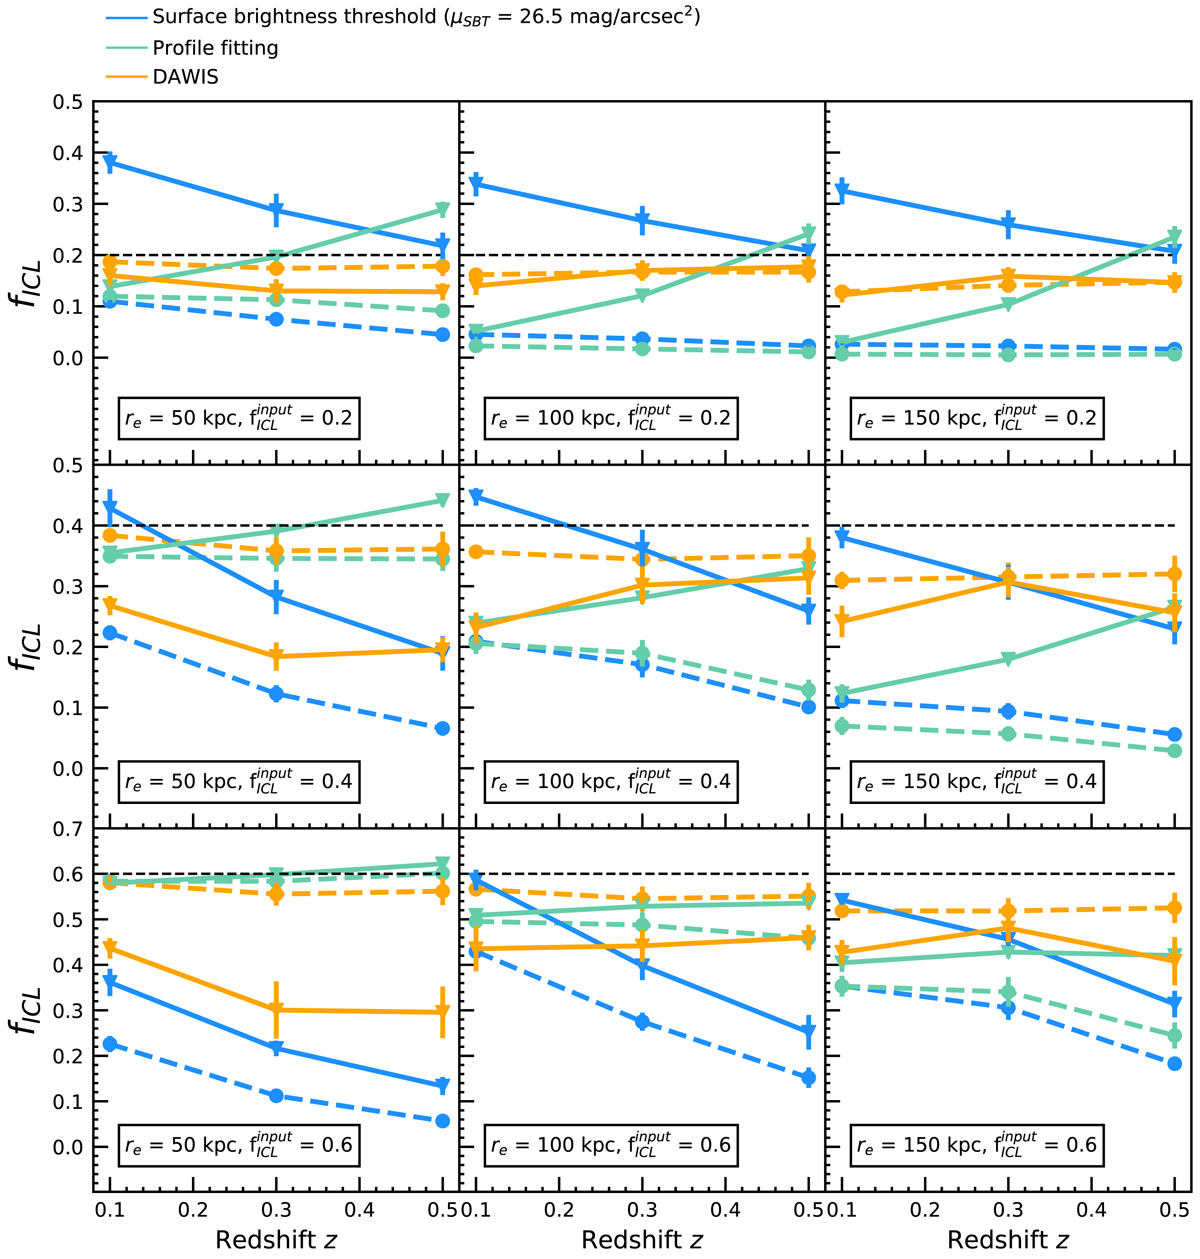
ICL fractions displayed for the different ICL profile parameters (half-light radius re, input ICL fraction ![]() , and redshift z) as measured by the different detection methods. The triangles with continuous lines are the ICL fractions fICL computed from each of the 270 GAL+ICL+NOISE MegaCam-type images, and the displayed values correspond to the average of the ten images with the same input parameters. The filled circles with dashed lines are the ICL fraction
, and redshift z) as measured by the different detection methods. The triangles with continuous lines are the ICL fractions fICL computed from each of the 270 GAL+ICL+NOISE MegaCam-type images, and the displayed values correspond to the average of the ten images with the same input parameters. The filled circles with dashed lines are the ICL fraction ![]() computed from the images with separated galaxies and ICL. The error bars correspond to standard deviations in ten different clusters. The input ICL fraction is also displayed as a horizontal black dashed line for better visualization.
computed from the images with separated galaxies and ICL. The error bars correspond to standard deviations in ten different clusters. The input ICL fraction is also displayed as a horizontal black dashed line for better visualization.
Current usage metrics show cumulative count of Article Views (full-text article views including HTML views, PDF and ePub downloads, according to the available data) and Abstracts Views on Vision4Press platform.
Data correspond to usage on the plateform after 2015. The current usage metrics is available 48-96 hours after online publication and is updated daily on week days.
Initial download of the metrics may take a while.