Fig. 3.
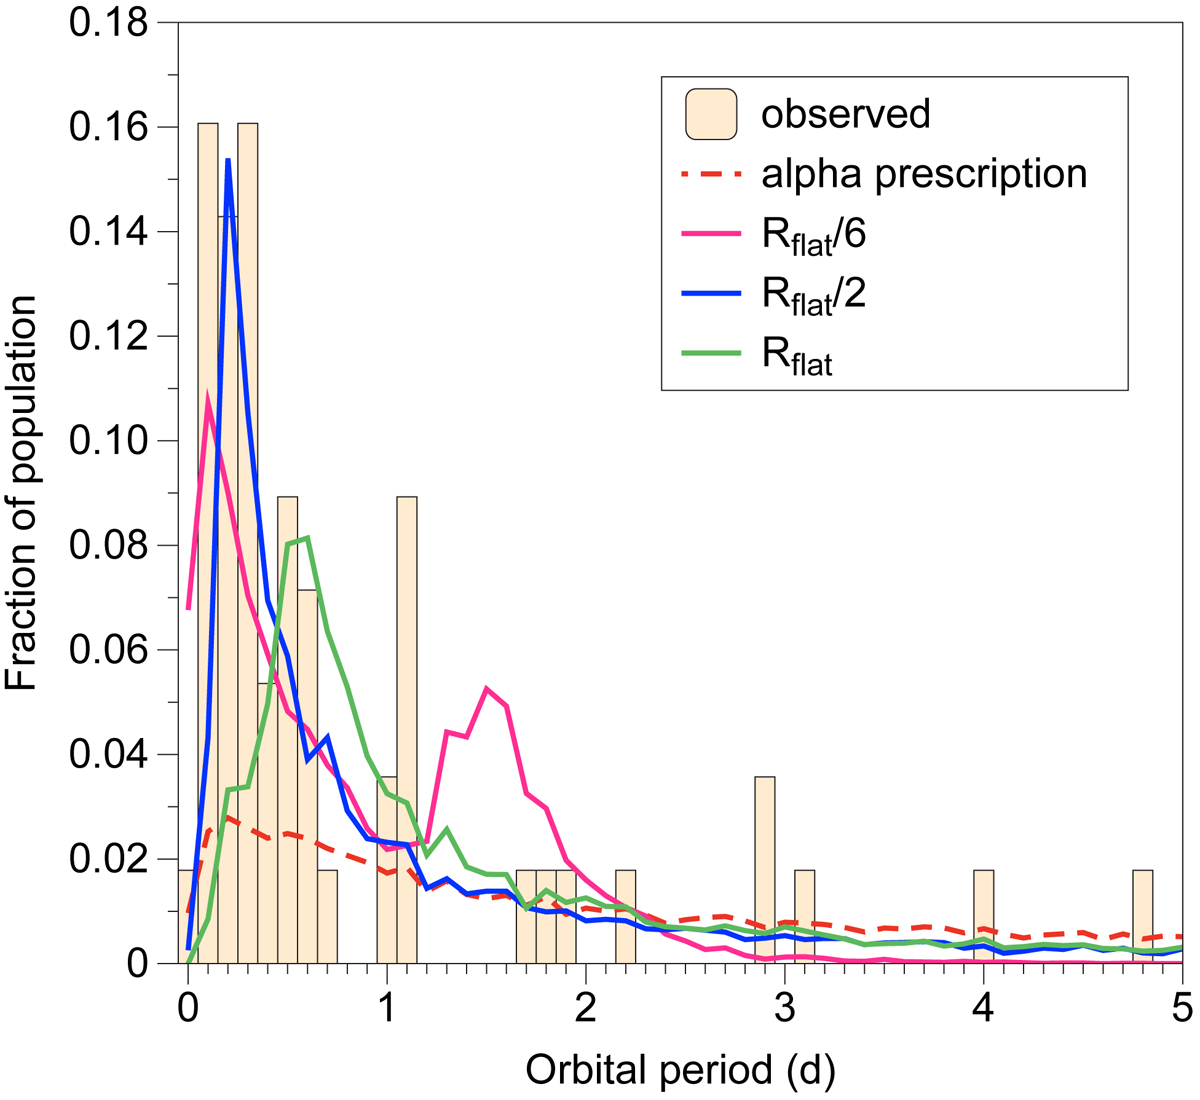
Model BPNe orbital period distributions for various values of Rhalt. The observed orbital period distribution in BPNe (histogram) and the orbital period distribution using the standard alpha prescription (red dashed line) are also shown for comparison. All distributions have been normalized to unity for the sake of comparison.
Current usage metrics show cumulative count of Article Views (full-text article views including HTML views, PDF and ePub downloads, according to the available data) and Abstracts Views on Vision4Press platform.
Data correspond to usage on the plateform after 2015. The current usage metrics is available 48-96 hours after online publication and is updated daily on week days.
Initial download of the metrics may take a while.