Open Access
Fig. 7.
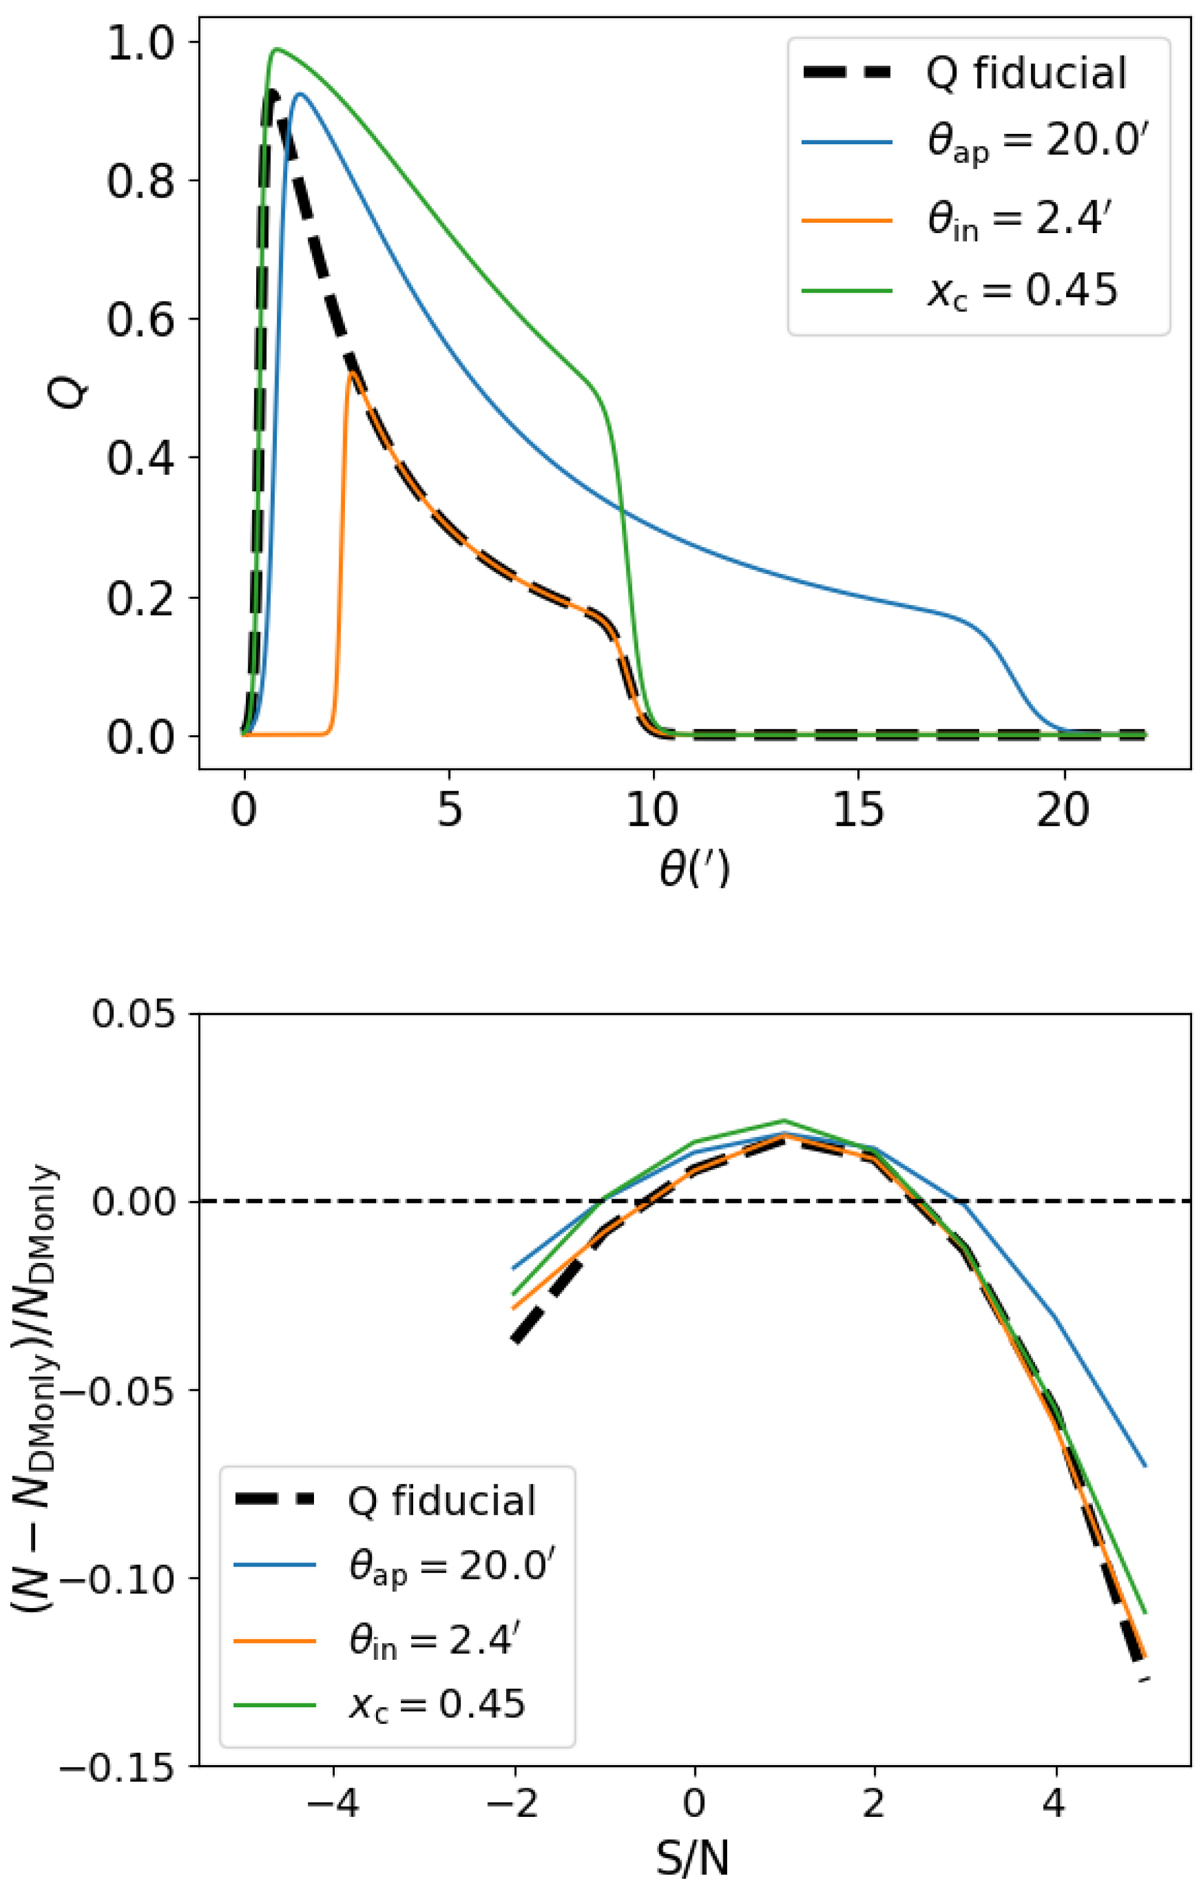
Top: profiles of the Q filters defined via Eq. (4) and used to mitigate the impact of baryons by reducing the weight of small scales. Bottom: relative change in the Map peak counts due to baryons for the various mitigation setups.
Current usage metrics show cumulative count of Article Views (full-text article views including HTML views, PDF and ePub downloads, according to the available data) and Abstracts Views on Vision4Press platform.
Data correspond to usage on the plateform after 2015. The current usage metrics is available 48-96 hours after online publication and is updated daily on week days.
Initial download of the metrics may take a while.