Fig. 9
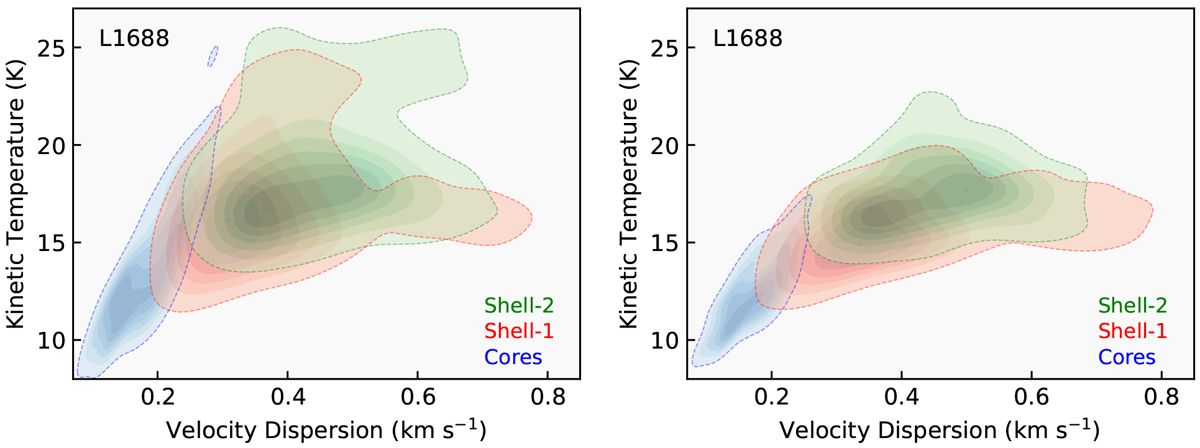
Left: distribution of kinetic temperature and velocity dispersion for all the coherent cores and the shell-1 and shell-2 regions. Shells-1 and shells-2 are defined as two consecutive shells of width equal to one beam around the respective coherent cores. Each kernel density distribution was normalised to have a peak density of 1. The contours show normalised KDE levels of 0.1, 0.25, 0.4, 0.55, 0.7 and 0.85. Right: same as the left panel, but without the regions L1688-SR3, L1688-SR2, and Oph-A, and ignoring one beam at each star position. This is done to remove the effect of external heating, and possiblecontribution from prostellar feedback.
Current usage metrics show cumulative count of Article Views (full-text article views including HTML views, PDF and ePub downloads, according to the available data) and Abstracts Views on Vision4Press platform.
Data correspond to usage on the plateform after 2015. The current usage metrics is available 48-96 hours after online publication and is updated daily on week days.
Initial download of the metrics may take a while.