Fig. 8
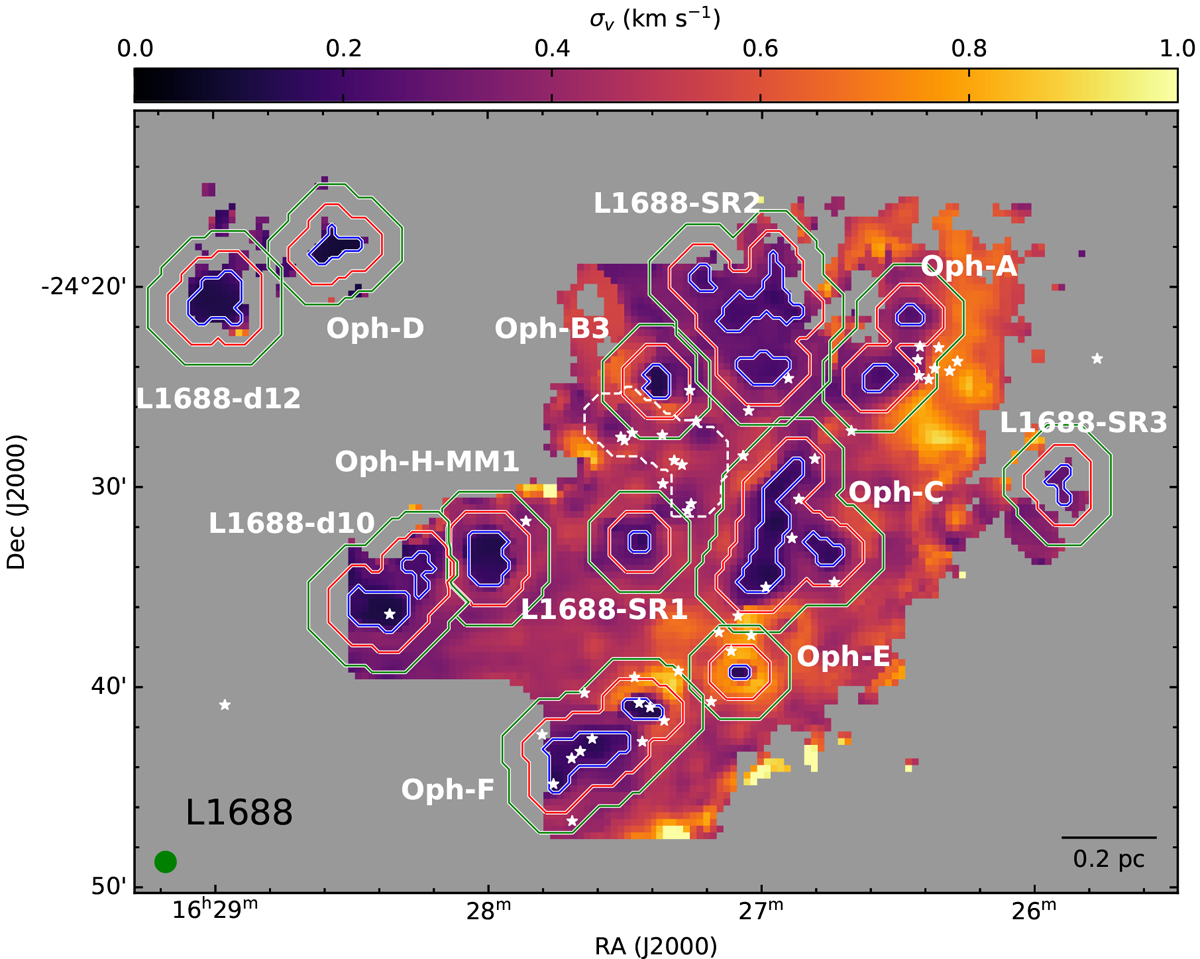
Coherent cores and their immediate neighbourhood, as defined in Sect. 4.4, shown in the velocity dispersion map. The coherent cores, and the shell-1 and shell-2 regions are shown with blue, red, and green contours, respectively.The white dashed contour shows the boundary considered for continuum cores Oph-B1 and Oph-B2 (see Sect. 4.4 for details). The white stars show the positions of Class 0/I and flat-spectrum protostars in the cloud. The beam and the scale bar are shown in the bottom left and bottom right corners, respectively.
Current usage metrics show cumulative count of Article Views (full-text article views including HTML views, PDF and ePub downloads, according to the available data) and Abstracts Views on Vision4Press platform.
Data correspond to usage on the plateform after 2015. The current usage metrics is available 48-96 hours after online publication and is updated daily on week days.
Initial download of the metrics may take a while.