Fig. 5
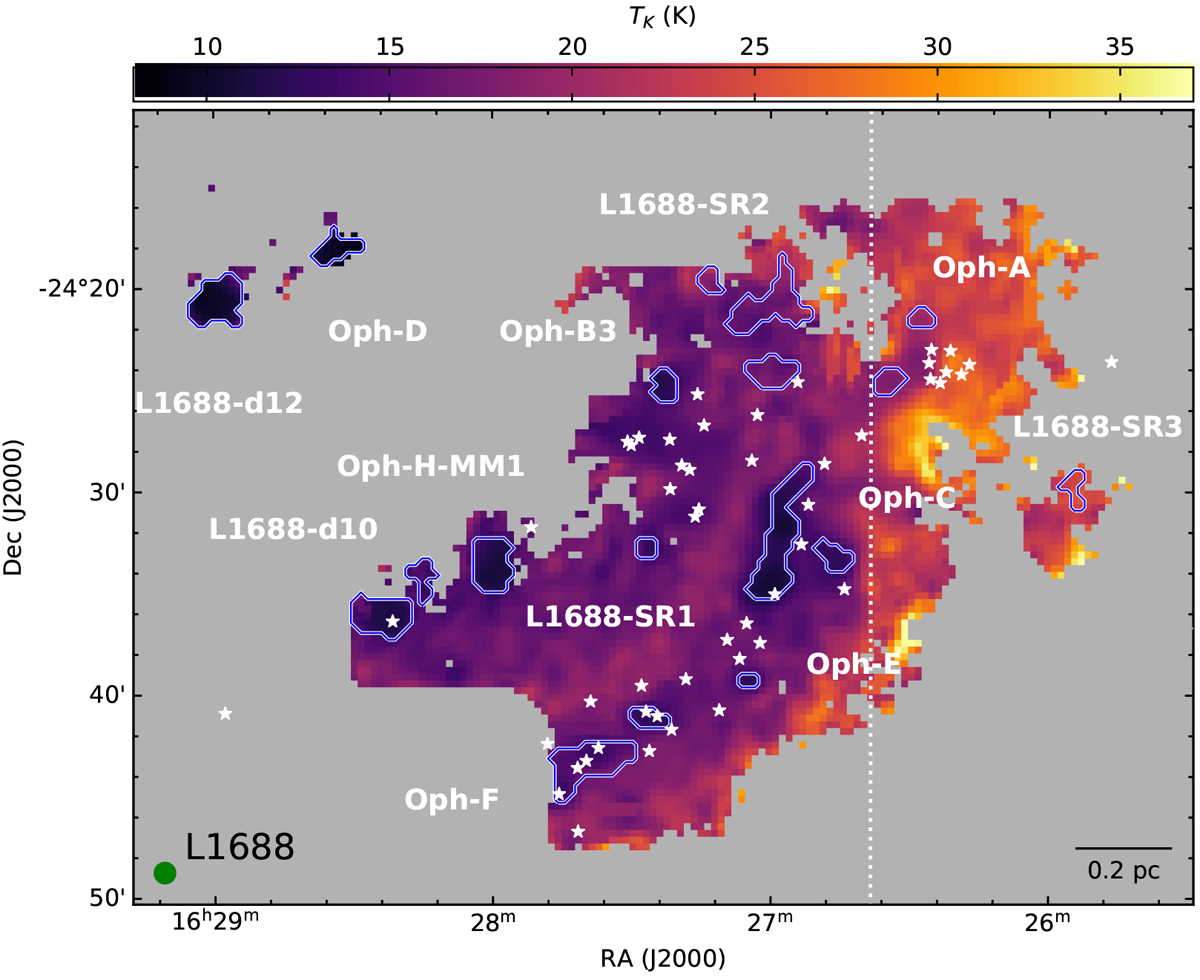
Kinetic temperature in L1688. The solid blue contours show the coherent cores in the region (described later in Sect. 4.4). The white stars show the positions of Class 0/I and flat-spectrum protostars. To see the difference between the part of the cloud affected by the external radiation, and the dark cloud further away from the illuminationsource, we consider a vertical boundary, as shown. The beam is shown in green in the bottom-left corner, and the scale bar is shown in the bottom-right corner.
Current usage metrics show cumulative count of Article Views (full-text article views including HTML views, PDF and ePub downloads, according to the available data) and Abstracts Views on Vision4Press platform.
Data correspond to usage on the plateform after 2015. The current usage metrics is available 48-96 hours after online publication and is updated daily on week days.
Initial download of the metrics may take a while.