Fig. 4
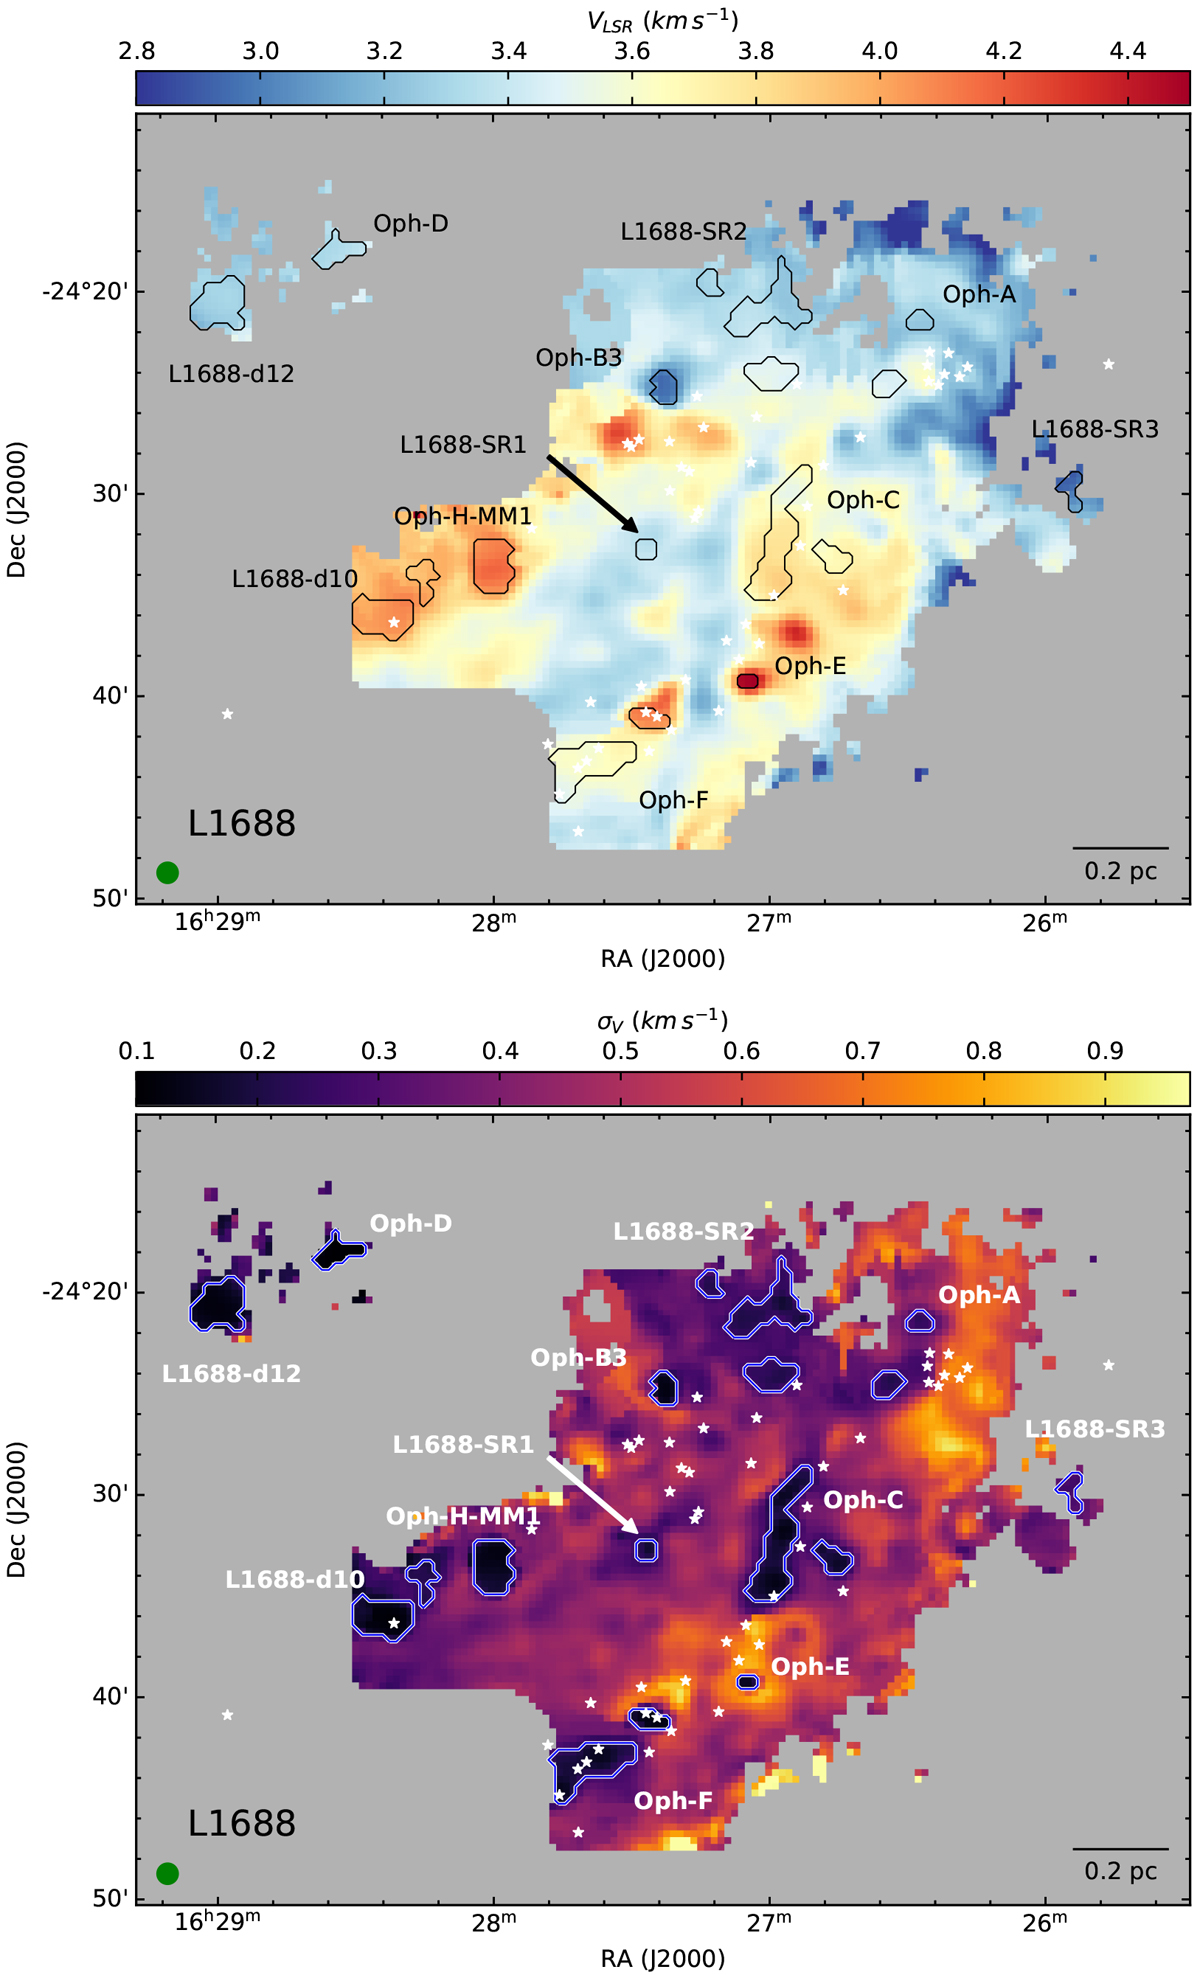
Centroid velocity (top panel) and velocity dispersion (bottom panel) in L1688. The solid black contours in the top panel and solid blue contours in the bottom panel show the coherent cores in the region (described later in Sect. 4.4). The black (top panel) and white (bottom panel) stars show the positions of Class 0/I and flat-spectrum protostars (Dunham et al. 2015). The beam is shown in green in the bottom-left corner, and the scale bar is shown in the bottom-right corner.
Current usage metrics show cumulative count of Article Views (full-text article views including HTML views, PDF and ePub downloads, according to the available data) and Abstracts Views on Vision4Press platform.
Data correspond to usage on the plateform after 2015. The current usage metrics is available 48-96 hours after online publication and is updated daily on week days.
Initial download of the metrics may take a while.