Fig. 3
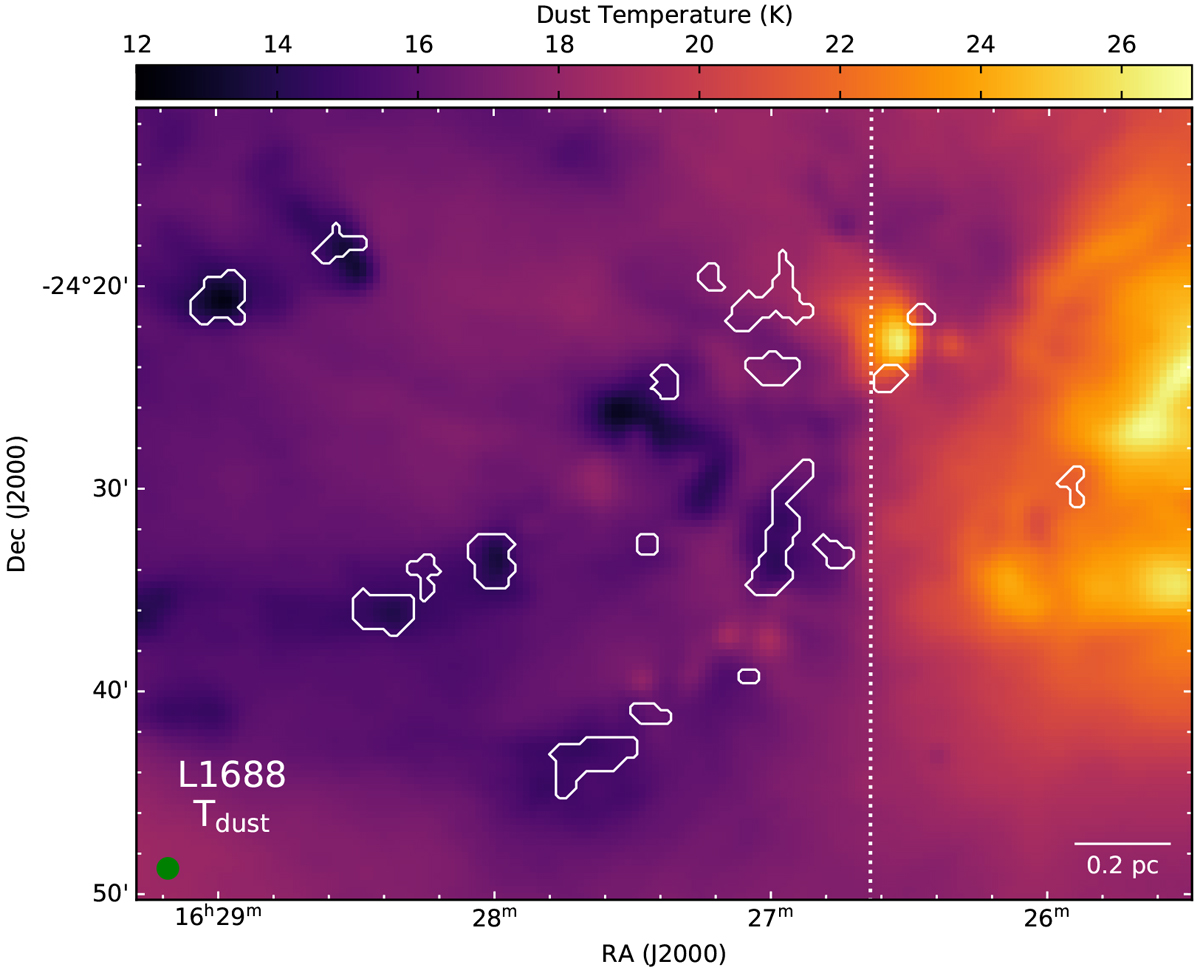
Dust temperature in L1688, taken from Herschel Gould Belt Survey archive. The solid white contours show the coherent cores in the region (described later in Sect. 4.4). The vertical dotted line roughly separates the dark cloud (to the left of the line) from the molecular material affected by the external illumination, due to irradiation from HD147889 (Habart et al. 2003). The 1′ beam, which the data was convolved to, is shown in green in the bottom-left corner, and the scale bar is shown in the bottom-right corner.
Current usage metrics show cumulative count of Article Views (full-text article views including HTML views, PDF and ePub downloads, according to the available data) and Abstracts Views on Vision4Press platform.
Data correspond to usage on the plateform after 2015. The current usage metrics is available 48-96 hours after online publication and is updated daily on week days.
Initial download of the metrics may take a while.