Fig. 2
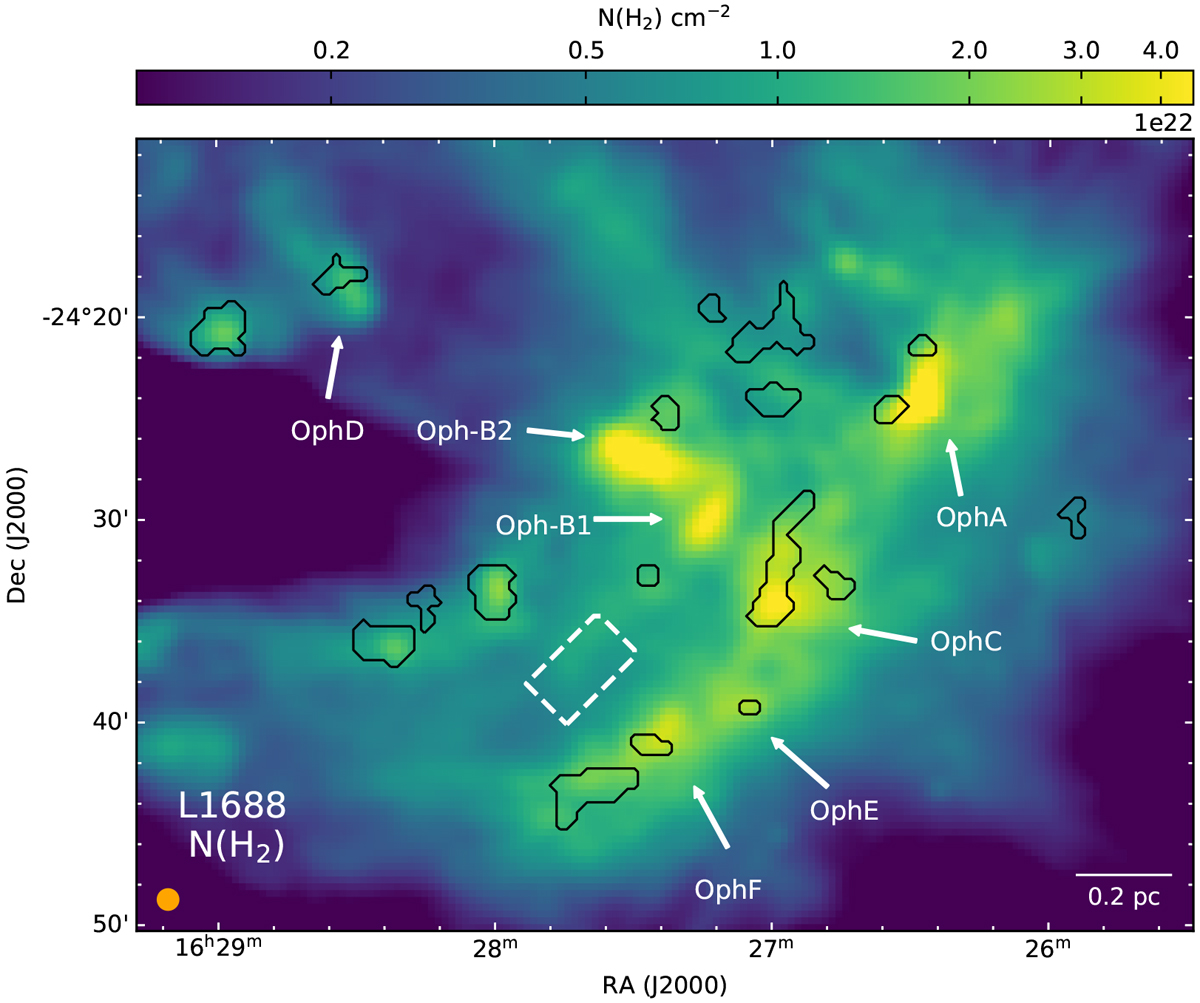
N(H2) in L1688, taken from Herschel Gould Belt Survey archive. Positions of the continuum cores reported in Motte et al. (1998) are indicated by arrows. The dashed rectangle shows the area used to calculate mean cloud properties (see Sect. 4.3). The solid black contours show the coherent cores in the region (described later in Sect. 4.4). The 1′ beam, which the data was convolved to, is shown in orange in the bottom-left corner, and the scale bar is shown in the bottom-right corner.
Current usage metrics show cumulative count of Article Views (full-text article views including HTML views, PDF and ePub downloads, according to the available data) and Abstracts Views on Vision4Press platform.
Data correspond to usage on the plateform after 2015. The current usage metrics is available 48-96 hours after online publication and is updated daily on week days.
Initial download of the metrics may take a while.