Fig. A.1
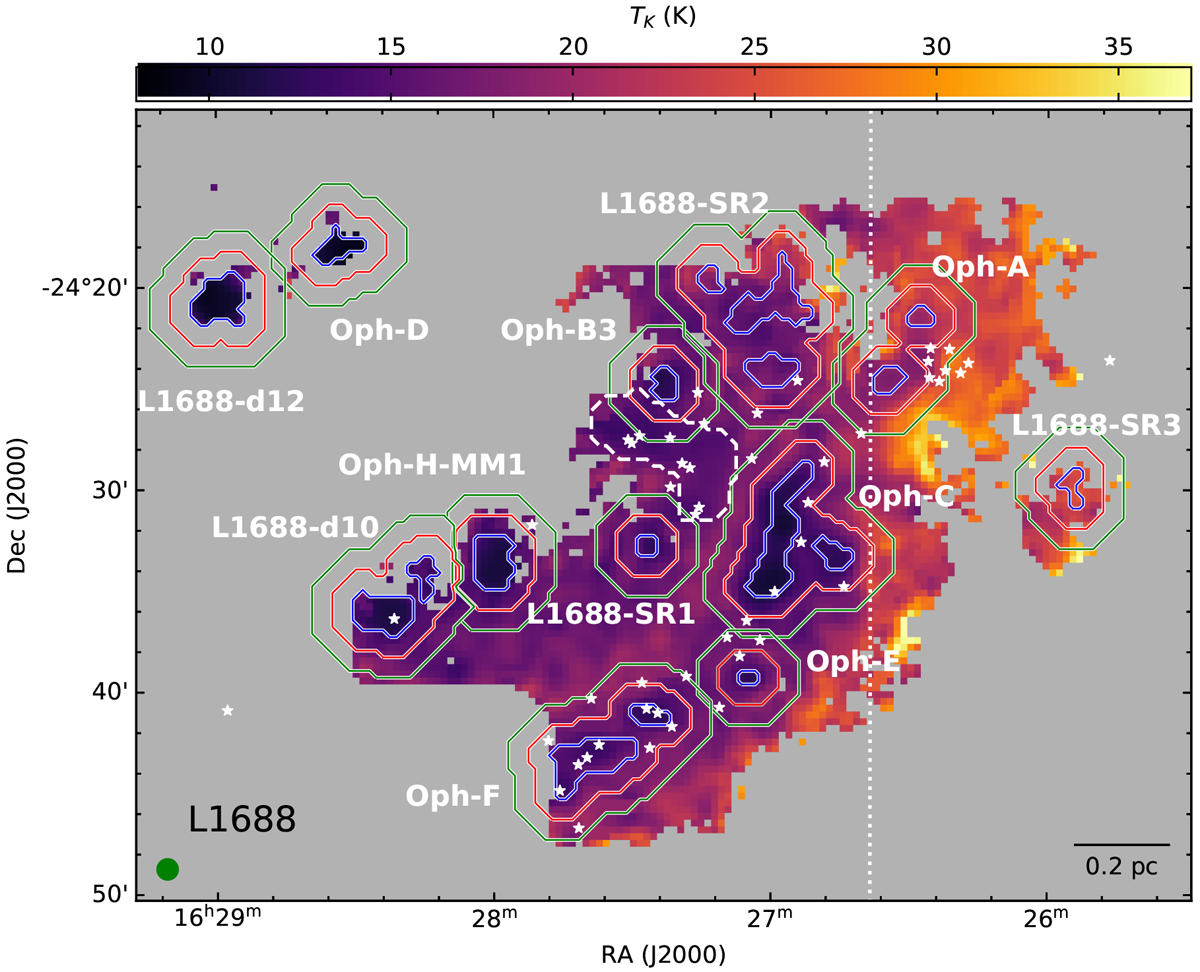
Coherent cores and shells-1 and -2, as defined in Sect. 4.4, are shown on the kinetic temperaturemap, with blue, red and green contours, respectively. The white stars show the positions of Class 0/I and flat-spectrum protostars in the cloud. The white dashed contour shows a rough boundary for Oph-B1 and Oph-B2 (see Sect. 4.4). The white dotted line roughly separates the dark cloud to the left from the molecular material affected by the external illumination to the right.
Current usage metrics show cumulative count of Article Views (full-text article views including HTML views, PDF and ePub downloads, according to the available data) and Abstracts Views on Vision4Press platform.
Data correspond to usage on the plateform after 2015. The current usage metrics is available 48-96 hours after online publication and is updated daily on week days.
Initial download of the metrics may take a while.