Fig. 18
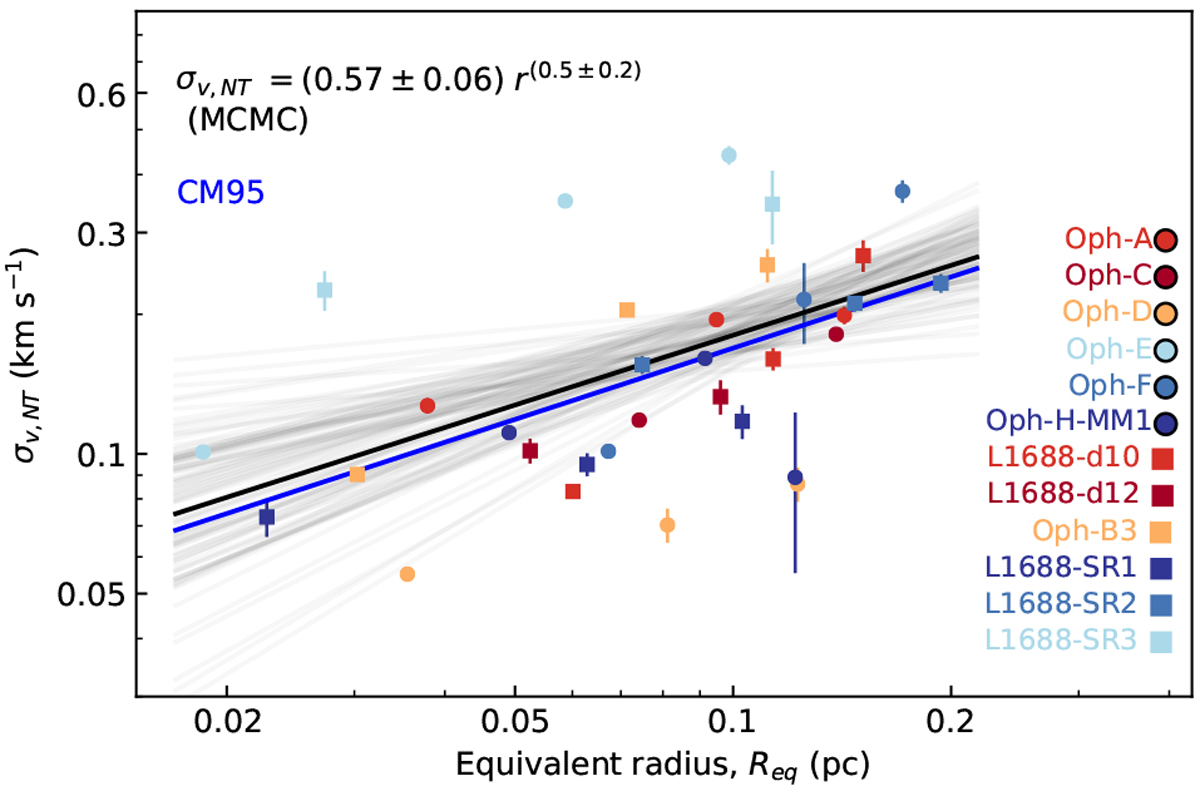
Non-thermal velocity dispersions in the narrow component for each core, shell-1, and shell-2 as a function of their equivalent radii. The grey lines show the power-law fits for the range of parameters obtained from a MCMC fit, and the black line shows the best-fit model. The blue line shows the turbulence–size relation from Caselli & Myers (1995) for low-mass cores.
Current usage metrics show cumulative count of Article Views (full-text article views including HTML views, PDF and ePub downloads, according to the available data) and Abstracts Views on Vision4Press platform.
Data correspond to usage on the plateform after 2015. The current usage metrics is available 48-96 hours after online publication and is updated daily on week days.
Initial download of the metrics may take a while.