Fig. 13
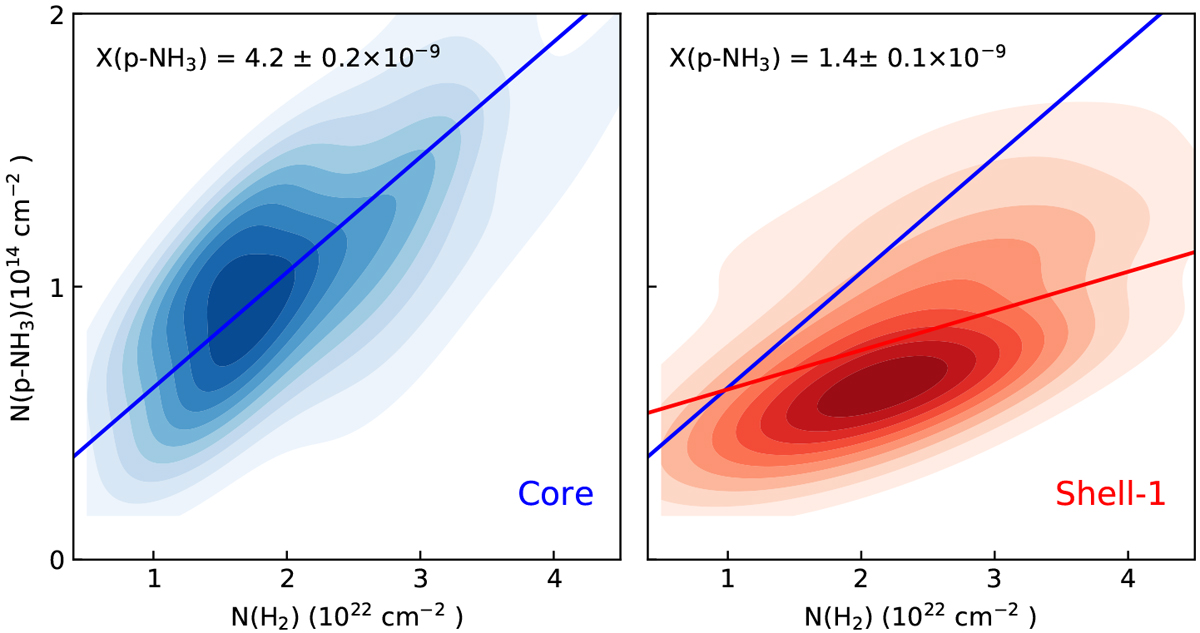
Kernel density estimate representation of the distribution of p-NH3 column density with N(H2) in the cores (in red) and shell-1 (in blue), as defined in Sect. 4.4 and shown in Fig. 8. The straight lines show the best linear fit to the data in the corresponding region. For comparison between the regions, the linear fit to the data in the cores (red line) is also shown in the plot for shell-1. The slopes of the linear fits indicate the fractional p-NH3 abundance (with respect to H2) in the region, which is shown in the top-left corner.
Current usage metrics show cumulative count of Article Views (full-text article views including HTML views, PDF and ePub downloads, according to the available data) and Abstracts Views on Vision4Press platform.
Data correspond to usage on the plateform after 2015. The current usage metrics is available 48-96 hours after online publication and is updated daily on week days.
Initial download of the metrics may take a while.