Fig. 12
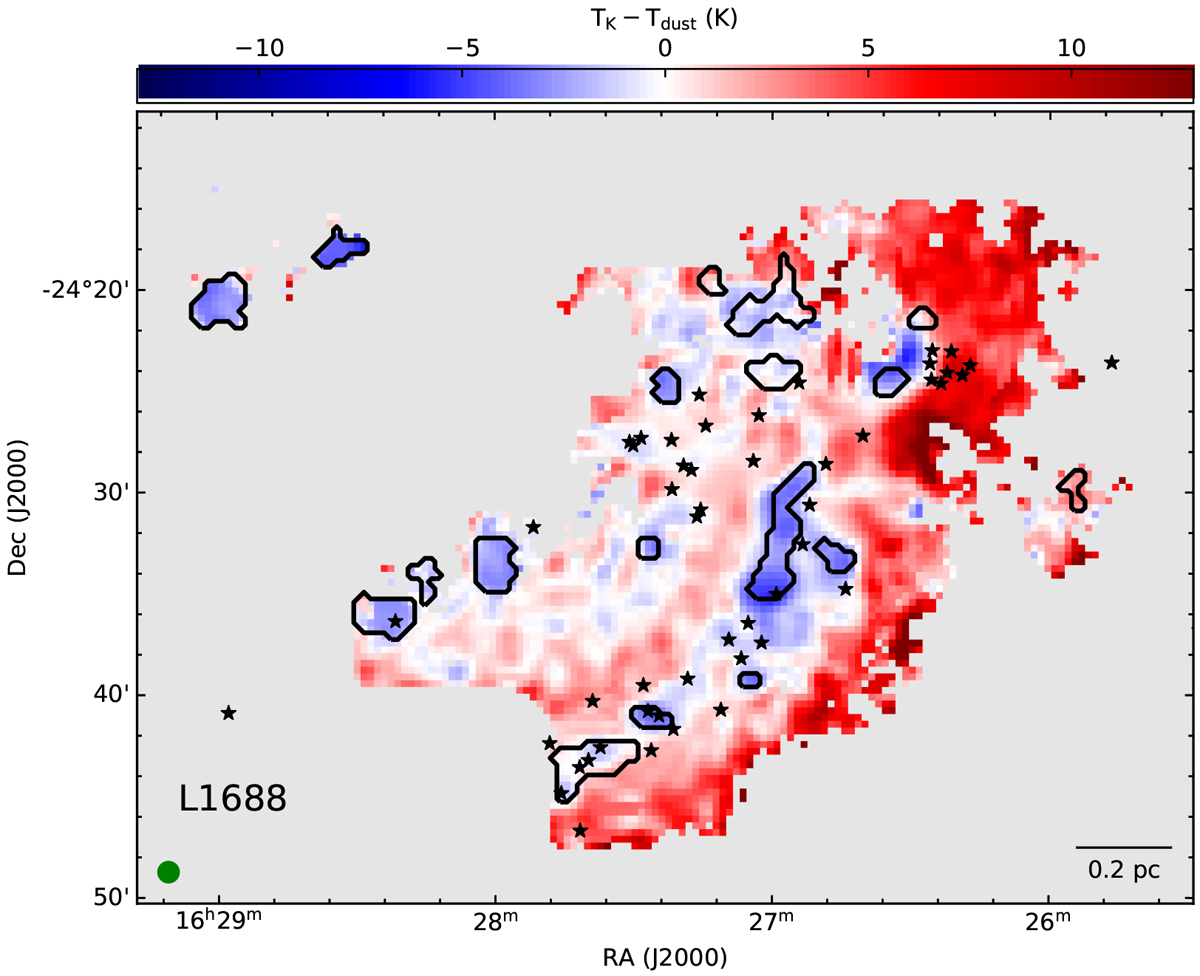
Map of the difference between kinetic temperature (from NH3) and dust temperature (from Herschel). The black stars show the positions of known protostars in the region. The solid black contours show the coherent cores in the region (see Sect. 4.4). The beam and the scale bar are shown in the bottom-left and bottom-right corners, respectively.
Current usage metrics show cumulative count of Article Views (full-text article views including HTML views, PDF and ePub downloads, according to the available data) and Abstracts Views on Vision4Press platform.
Data correspond to usage on the plateform after 2015. The current usage metrics is available 48-96 hours after online publication and is updated daily on week days.
Initial download of the metrics may take a while.