Fig. 1
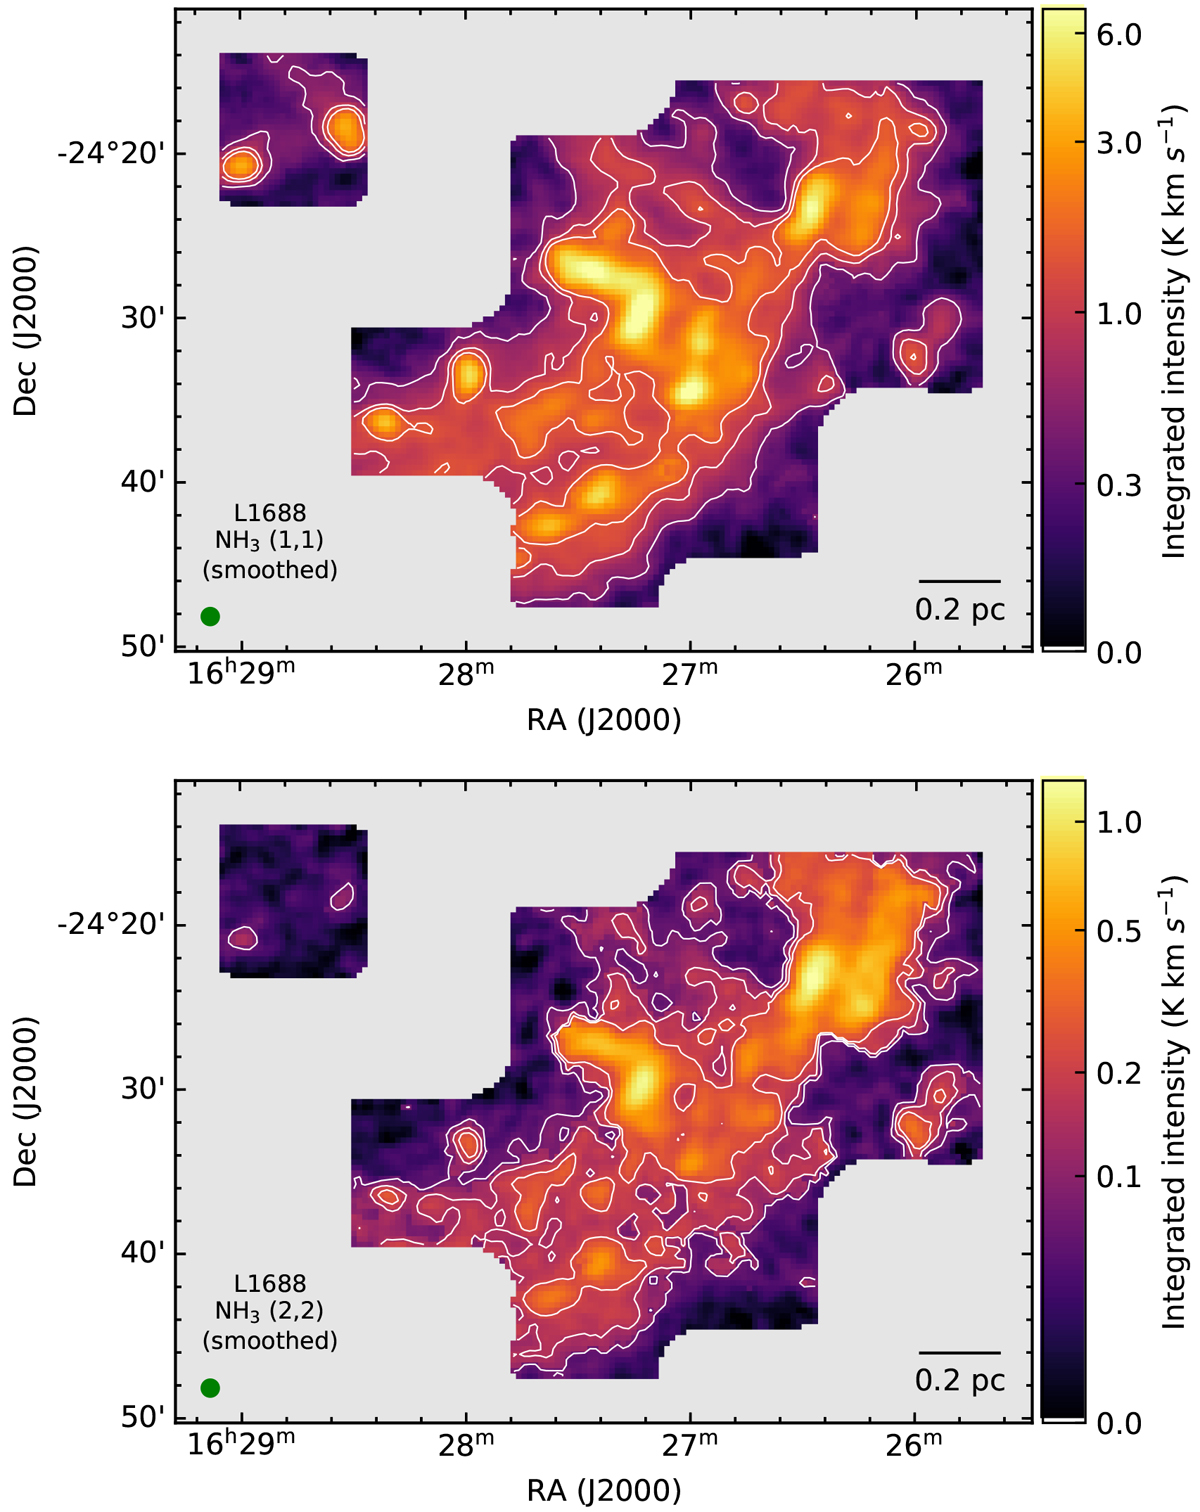
Integrated intensity maps of NH3 (1,1) (top) and (2,2) (bottom) lines. For NH3 (1,1), the contour levels indicate 15σ,30σ, and 45σ, and for NH3 (2,2), contours are shown for 6σ,12σ, and 18σ; where σ is the median error in emitted intensity calculated from the signal-free spectral range in each pixel and converted to the error in integrated intensity. The moment maps were improved by considering only the spectral range containing emission, as described in Sect. 4.1. The 1′ beam, which the data was convolved to, is shown in green in the bottom-left corner, and the scale bar is shown in the bottom-right corner.
Current usage metrics show cumulative count of Article Views (full-text article views including HTML views, PDF and ePub downloads, according to the available data) and Abstracts Views on Vision4Press platform.
Data correspond to usage on the plateform after 2015. The current usage metrics is available 48-96 hours after online publication and is updated daily on week days.
Initial download of the metrics may take a while.