Fig. 9
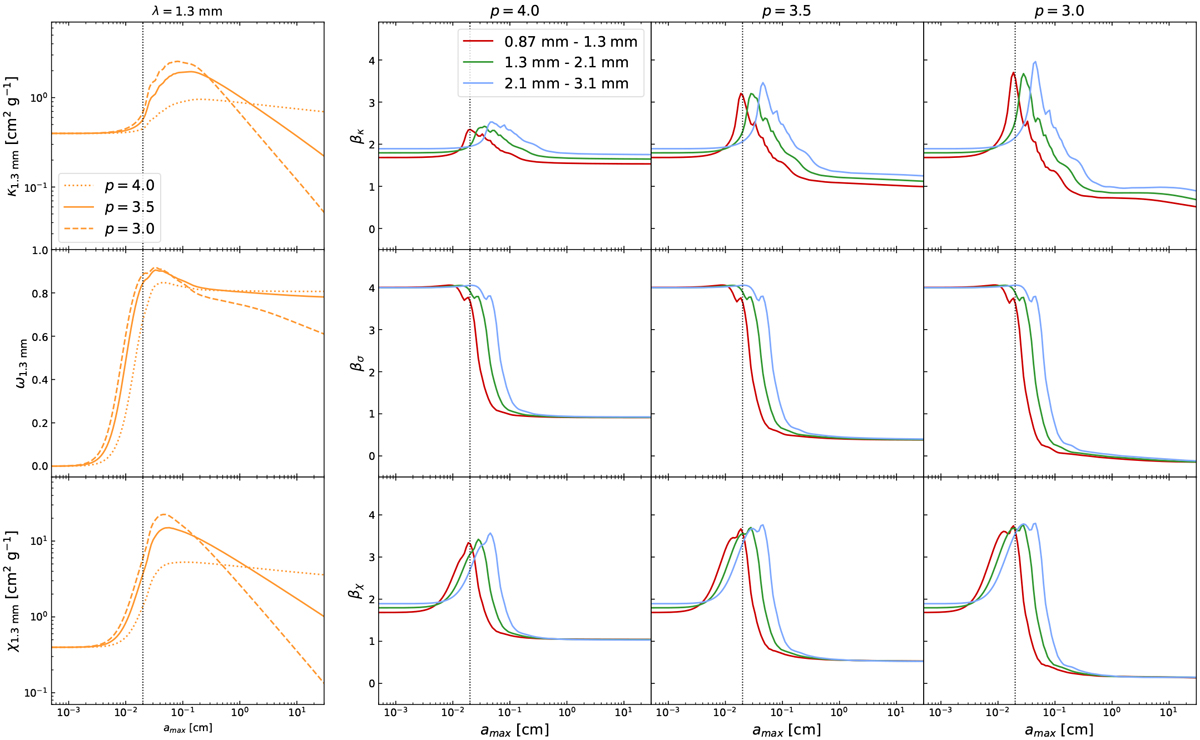
Opacity laws used in the modeling of the multiwavelength observations. Left panels: absorption opacity (top), albedo (middle), and total extinction (bottom) at 1.3 mm as a function of maximum grain size (amax), for three values of the power-law index of the particle size distribution (p). The nine panels on the right show the spectral index of the absorption opacity (βκ ; top), the scattering opacity (βσ; middle), andthe total extinction (βχ; bottom) between the different wavelengths of our data, as a function of amax, and for p = 4.0 (left column), p = 3.5 (middle column), and p = 3.0 (right column). The vertical dashed line in all the panels indicates amax = 200 μm, the limit we set to separate between the two families of solutions in our analysis.
Current usage metrics show cumulative count of Article Views (full-text article views including HTML views, PDF and ePub downloads, according to the available data) and Abstracts Views on Vision4Press platform.
Data correspond to usage on the plateform after 2015. The current usage metrics is available 48-96 hours after online publication and is updated daily on week days.
Initial download of the metrics may take a while.