Fig. 8
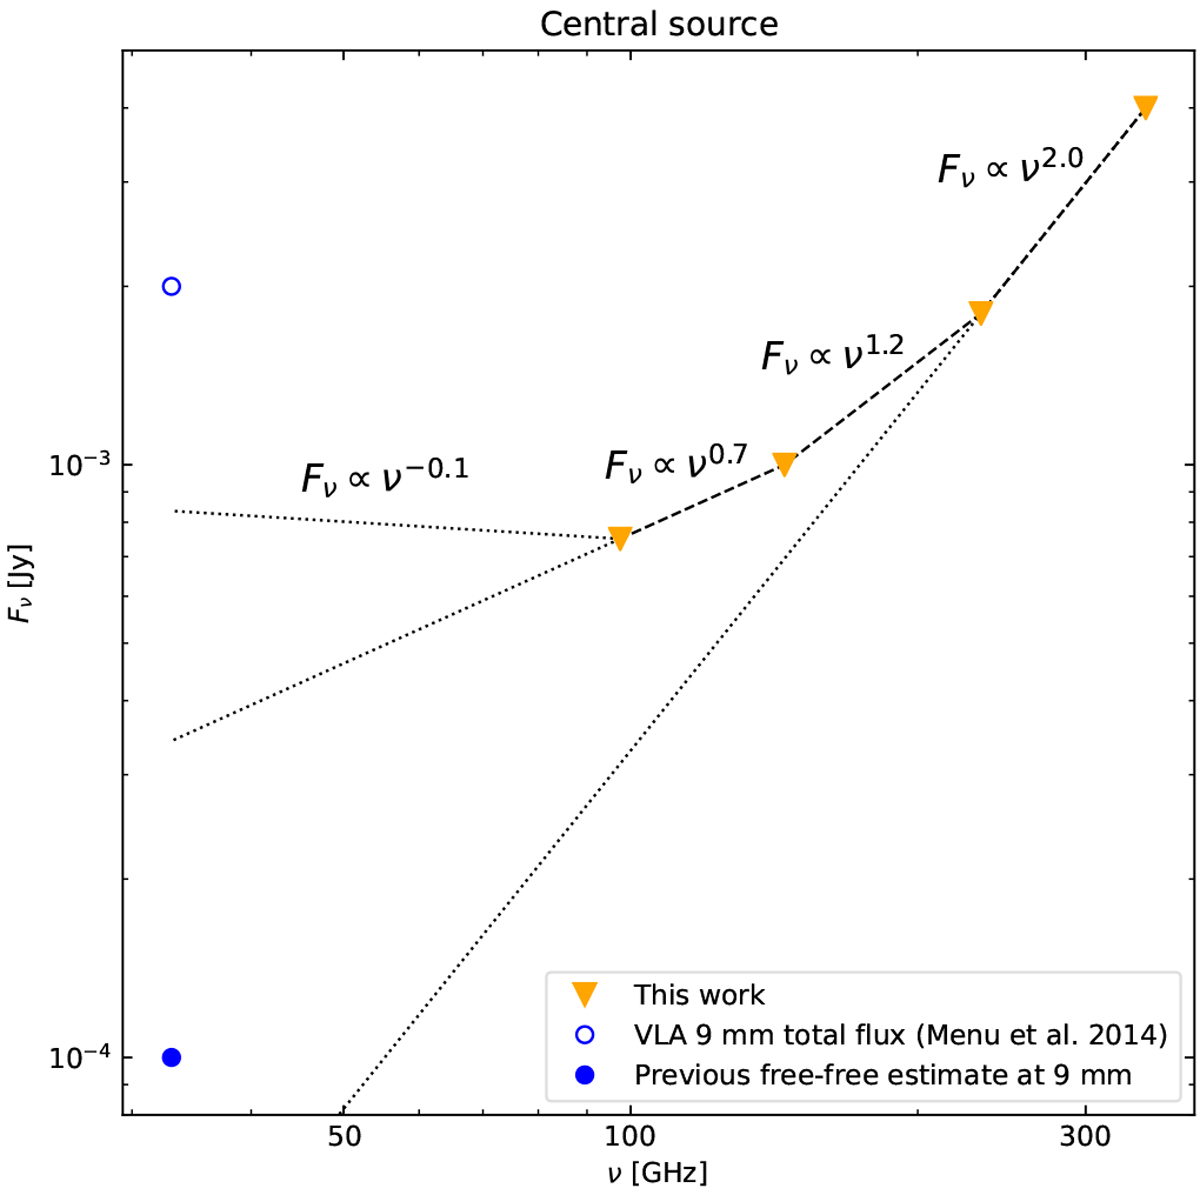
Spectral energy distribution (SED) of the central source of emission located inside the 3 au cavity in TW Hya. The orange triangles indicate the fluxes estimated from our high angular resolution observations at 0.87, 1.3, 2.1, and 3.1 mm (see insets in Fig. 1). The blue empty circle indicate the VLA 9 mm flux of TW Hya (Menu et al. 2014), while the filled blue circle shows the estimated free–free contribution at this wavelength reported by these authors. The dashed lines depict the spectral indices of the central source inferred from our observations. The dotted lines show different extrapolations of this source’s flux up to 9 mm, demonstrating that the free–free emission at this position is higher than previously thought.
Current usage metrics show cumulative count of Article Views (full-text article views including HTML views, PDF and ePub downloads, according to the available data) and Abstracts Views on Vision4Press platform.
Data correspond to usage on the plateform after 2015. The current usage metrics is available 48-96 hours after online publication and is updated daily on week days.
Initial download of the metrics may take a while.