Fig. 7
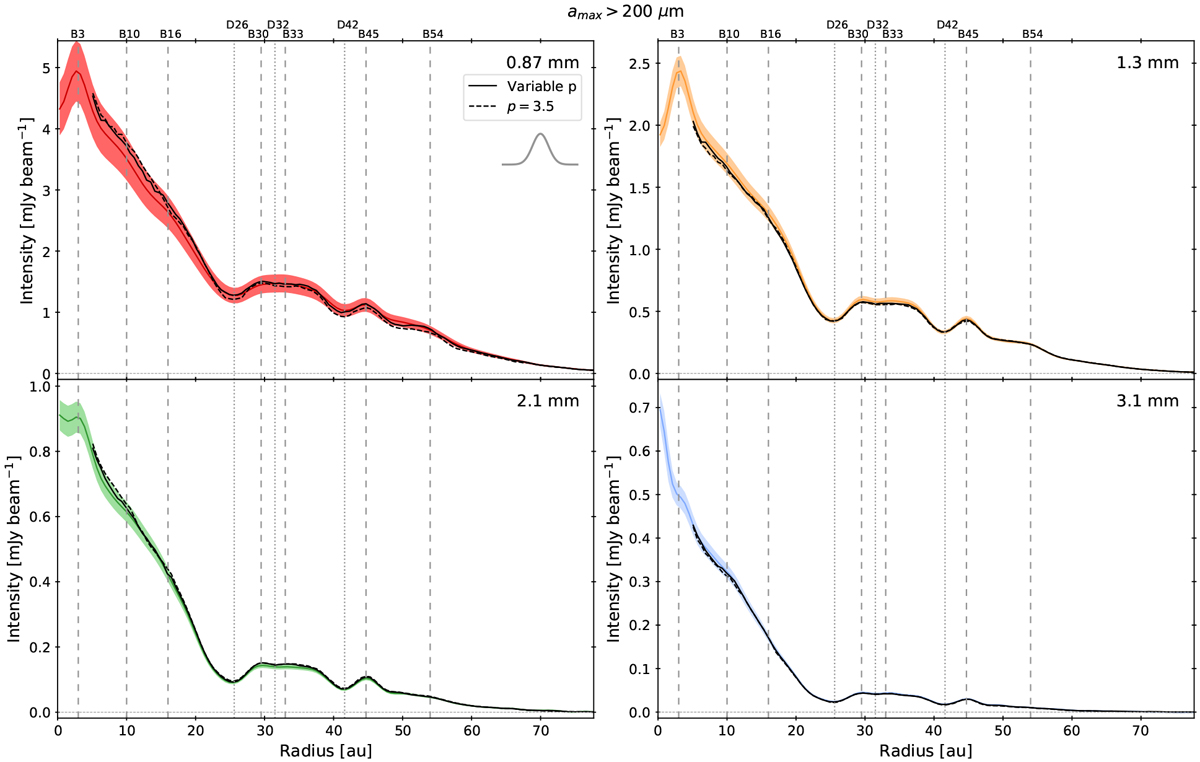
Radial intensity profiles of the dust emission of the disk around TW Hya at 0.87 (top-left), 1.3 (top-right), 2.1 (bottom-left), and 3.1 mm (bottom-right) convolved to a circular 0.″05 beam. The colored shaded regions indicate the error bars at each radius (including the flux calibration error). The solid and dashed lines show the model intensity profile with maximum posterior probability for amax > 200 μm, using a varying p or fixing it top = 3.5, respectively. The Gaussian inset in the top-left panel displays the beam shape (the same at the four wavelengths). Our model is able to accurately reproduce the observed profiles at all radii except r < 20 au.
Current usage metrics show cumulative count of Article Views (full-text article views including HTML views, PDF and ePub downloads, according to the available data) and Abstracts Views on Vision4Press platform.
Data correspond to usage on the plateform after 2015. The current usage metrics is available 48-96 hours after online publication and is updated daily on week days.
Initial download of the metrics may take a while.