Fig. 5
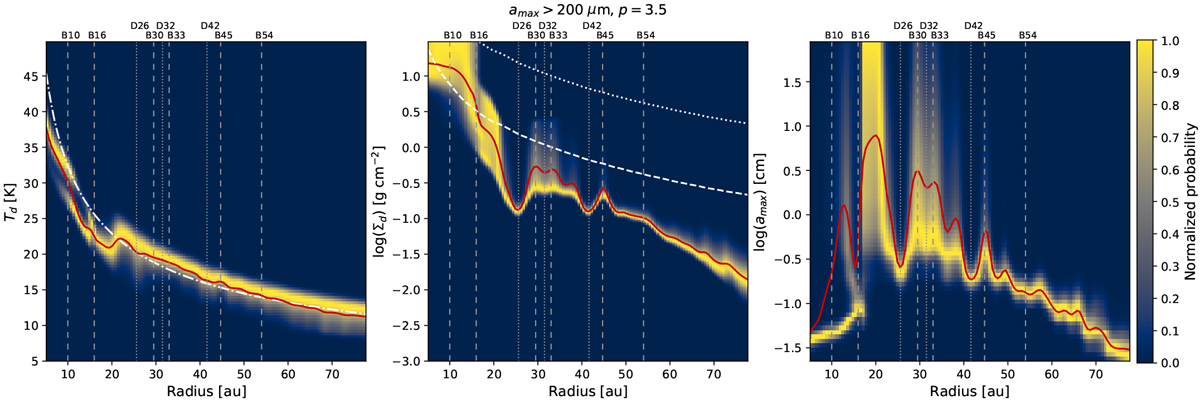
Marginalized posterior probability distributions of the model parameters fitted to the multiwavelength observations assuming amax > 200 μm and with p = 3.5. In order to facilitate its visualization, the posterior probabilities are normalized to the maximum marginalized probability at each radius. The vertical dashed and dotted lines indicate the positions of the bright and dark ringsin the disk, respectively. The white dashed line in the left plot shows the temperature profile derived from Eq. (6), used as the reference for the temperature prior. The white dashed and dotted curves in the surface density plot show the dust surface density profiles for which the Toomre Q parameter equals 1, assuming a gas to dust ratio of 100 or 10, respectively. The red curve in each panel shows the expected value of the corresponding parameters at each radius, computed using Eq. (7).
Current usage metrics show cumulative count of Article Views (full-text article views including HTML views, PDF and ePub downloads, according to the available data) and Abstracts Views on Vision4Press platform.
Data correspond to usage on the plateform after 2015. The current usage metrics is available 48-96 hours after online publication and is updated daily on week days.
Initial download of the metrics may take a while.