Fig. 4
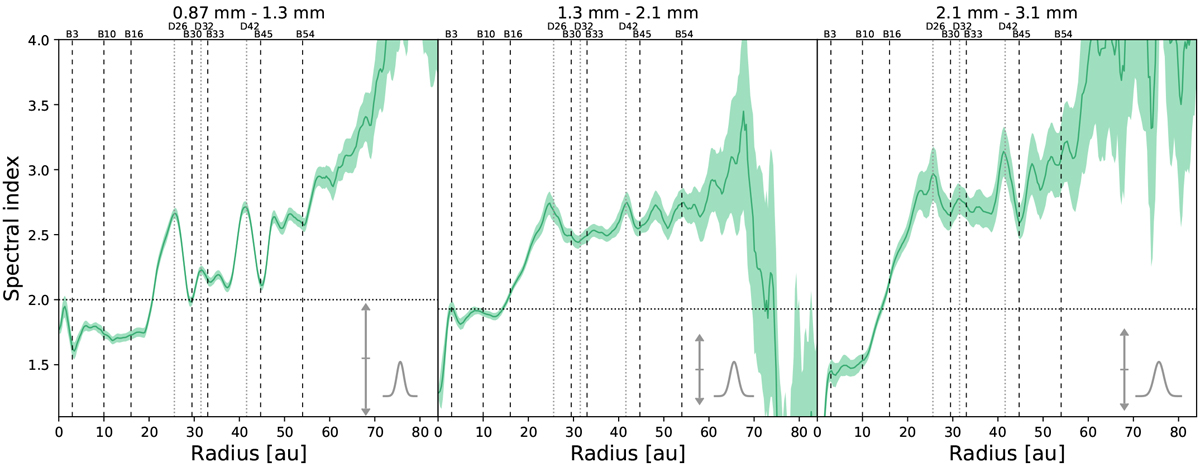
Spectral index radial profiles of the dust emission of the disk around TW Hya between 0.87 and 1.3 mm (left), 1.3 and 2.1 mm (middle), and 2.1 and 3.1 mm (right). These radial profiles were obtained by azimuthally averaging the spectral index maps obtained with the multiband imaging in tclean (see Sect. 2). The shaded colored regions indicate the error of the mean at each radii, computed as in the averaged radial intensity profiles. The Gaussian insets in the lower-right corner of each plot show the geometric mean of the beam size. The gray error bars in the lower-right corner of each plot indicate the maximum possible vertical shift of the spectral index profiles introduced by flux calibration systematic errors. We note that these shifts would affect all radii simultaneously, so they do not affect the relative shape of the spectral index profiles. The vertical dashed and dotted lines are the same as in Fig. 2.
Current usage metrics show cumulative count of Article Views (full-text article views including HTML views, PDF and ePub downloads, according to the available data) and Abstracts Views on Vision4Press platform.
Data correspond to usage on the plateform after 2015. The current usage metrics is available 48-96 hours after online publication and is updated daily on week days.
Initial download of the metrics may take a while.