Fig. 2

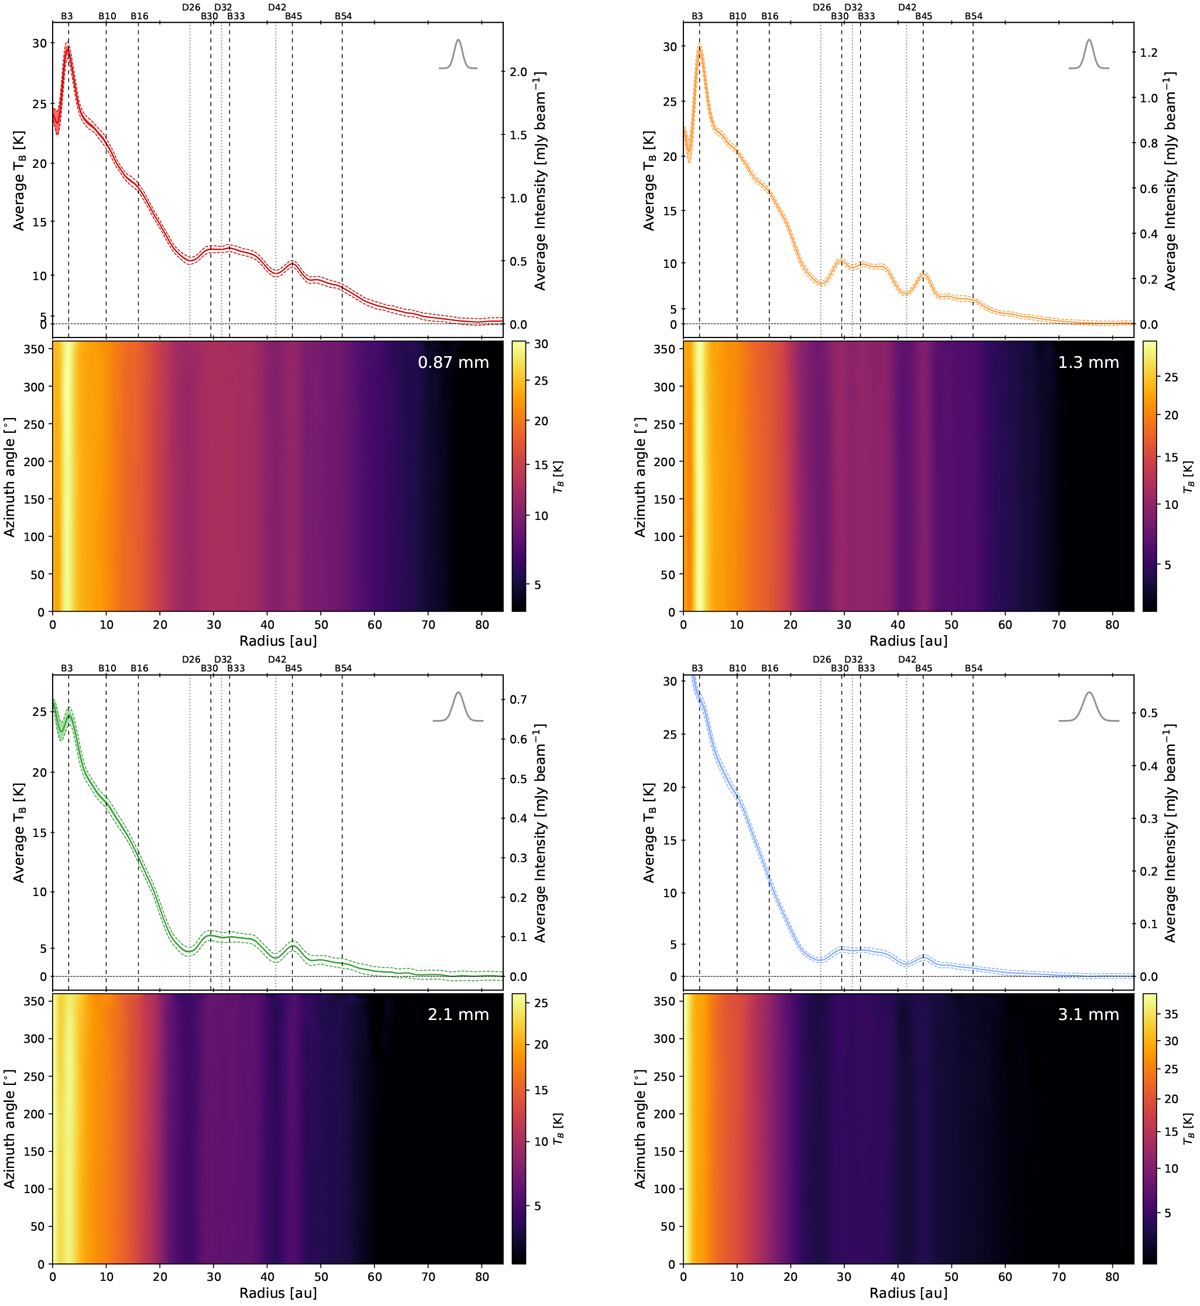
Deprojected images (bottom half of each panel) and azimuthally averaged radial intensity profile (top half of each panel)of the disk of TW Hya at 0.87 mm (top-left), 1.3 mm (top-right), 2.1 mm (bottom-left), and 3.1 mm (bottom-right). The shaded color regions in each profile indicate the error of the mean at each radius, while the colored dashed lines show the standard deviation for comparison. The vertical lines mark the positions of the bright (dashed) and dark (dotted) rings in the disk. The top right insets in the radial profile panels show the geometric mean of the beam size of each image. We note that the vertical axis scale in the radial profile at 3.1 mm is intentionally cut to better display the disk emission. A better view of the disk inner region at this wavelength is shown in Fig. 3.
Current usage metrics show cumulative count of Article Views (full-text article views including HTML views, PDF and ePub downloads, according to the available data) and Abstracts Views on Vision4Press platform.
Data correspond to usage on the plateform after 2015. The current usage metrics is available 48-96 hours after online publication and is updated daily on week days.
Initial download of the metrics may take a while.


