Fig. B.1
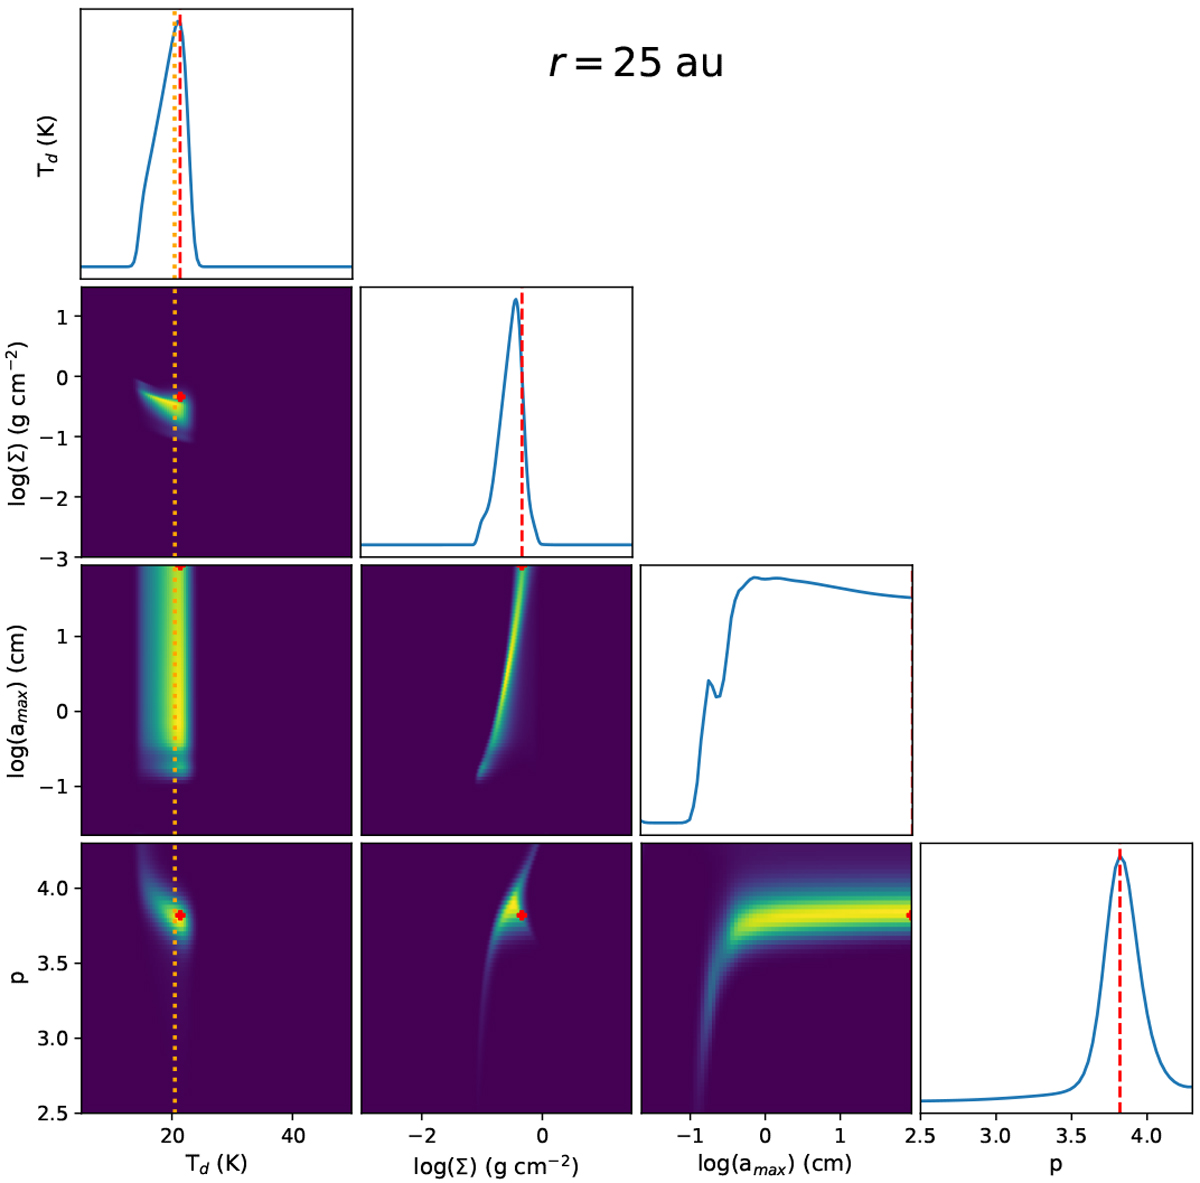
Marginalized 2D posterior probability distribution between the different pairs of parameters in our amax > 200 μm model at the position of the D25 gap (r = 25 au). The red dots and vertical lines indicate the values of the parameters at the maximum of the posterior probability distribution (not marginalized). The vertical dotted orange line indicates the central value of the temperature prior, obtained from Eq. (6).
Current usage metrics show cumulative count of Article Views (full-text article views including HTML views, PDF and ePub downloads, according to the available data) and Abstracts Views on Vision4Press platform.
Data correspond to usage on the plateform after 2015. The current usage metrics is available 48-96 hours after online publication and is updated daily on week days.
Initial download of the metrics may take a while.