Free Access
Fig. A.3
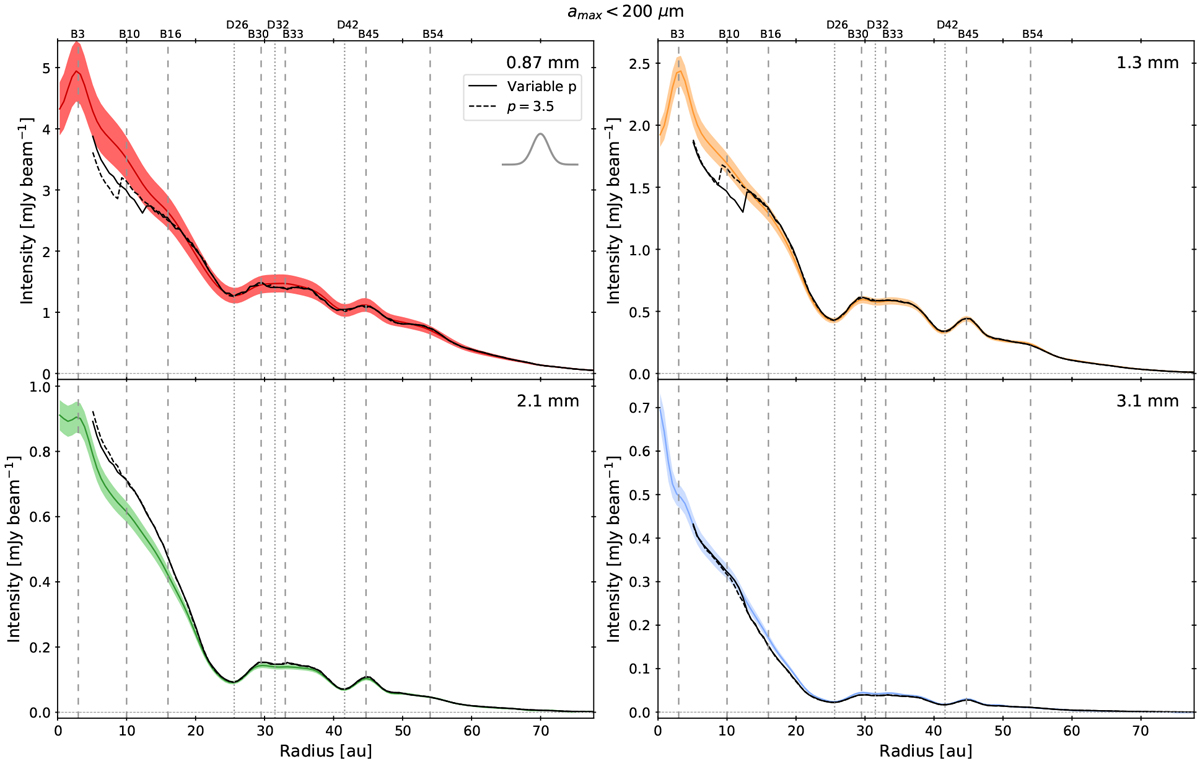
Observed intensity profiles and model profiles with maximum posterior probability, focusing on the family of solutionswith smaller maximum grain sizes. The lines and colors are the same as Fig. 7 but for amax < 200 μm.
Current usage metrics show cumulative count of Article Views (full-text article views including HTML views, PDF and ePub downloads, according to the available data) and Abstracts Views on Vision4Press platform.
Data correspond to usage on the plateform after 2015. The current usage metrics is available 48-96 hours after online publication and is updated daily on week days.
Initial download of the metrics may take a while.