Free Access
Fig. 9.
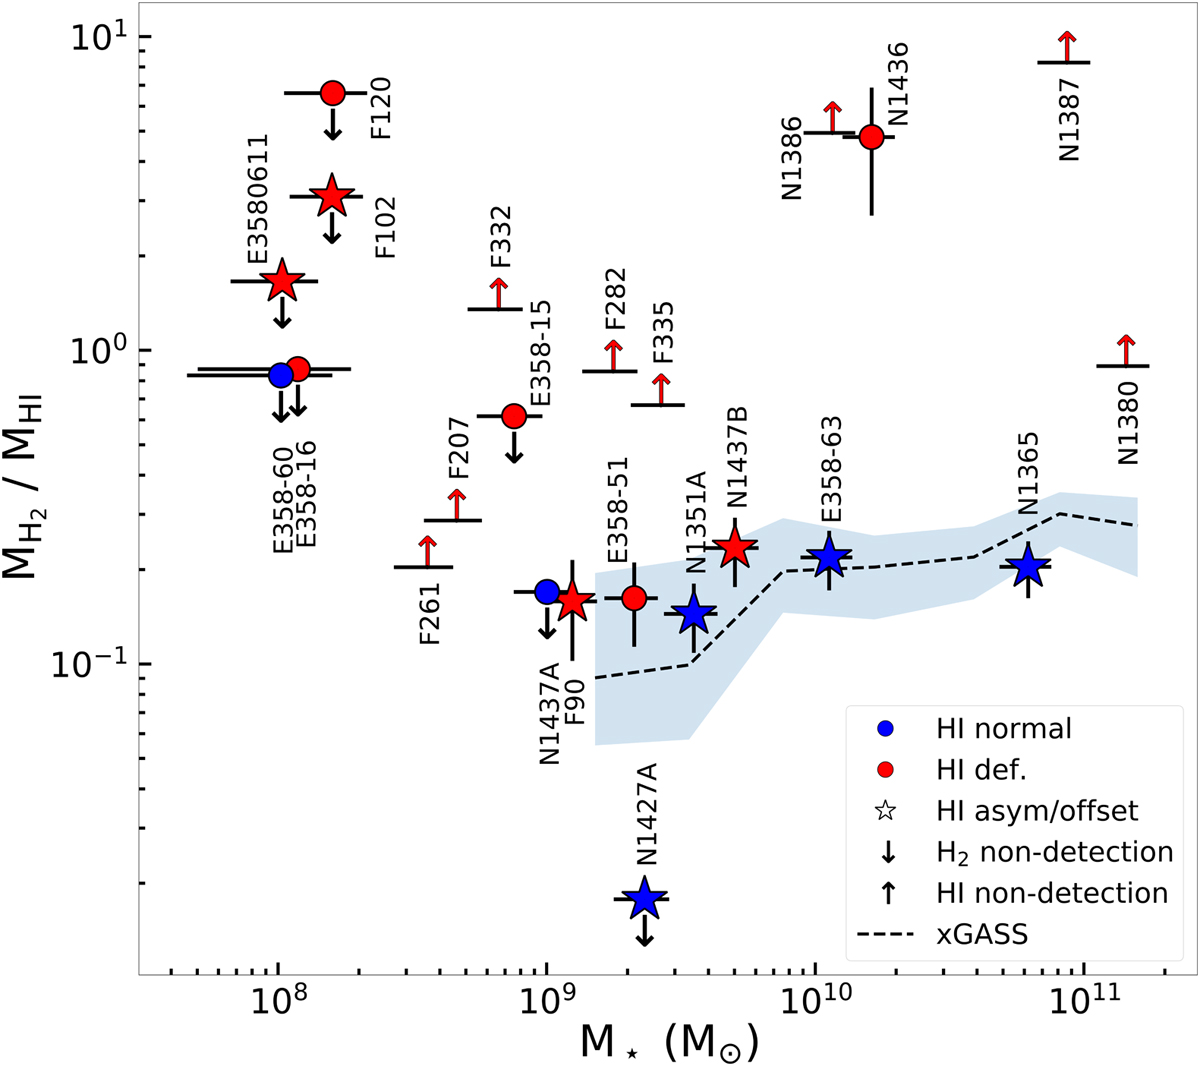
MH2/MHI as a function of M⋆. We use the same colour coding as Fig. 6. Blue shadow shows 1 × σ scatter from the xGASS weighted average of log10(MH2/MHI). We show upper limits with downward arrows. We show lower limits with upward arrows.
Current usage metrics show cumulative count of Article Views (full-text article views including HTML views, PDF and ePub downloads, according to the available data) and Abstracts Views on Vision4Press platform.
Data correspond to usage on the plateform after 2015. The current usage metrics is available 48-96 hours after online publication and is updated daily on week days.
Initial download of the metrics may take a while.