Fig. 7.
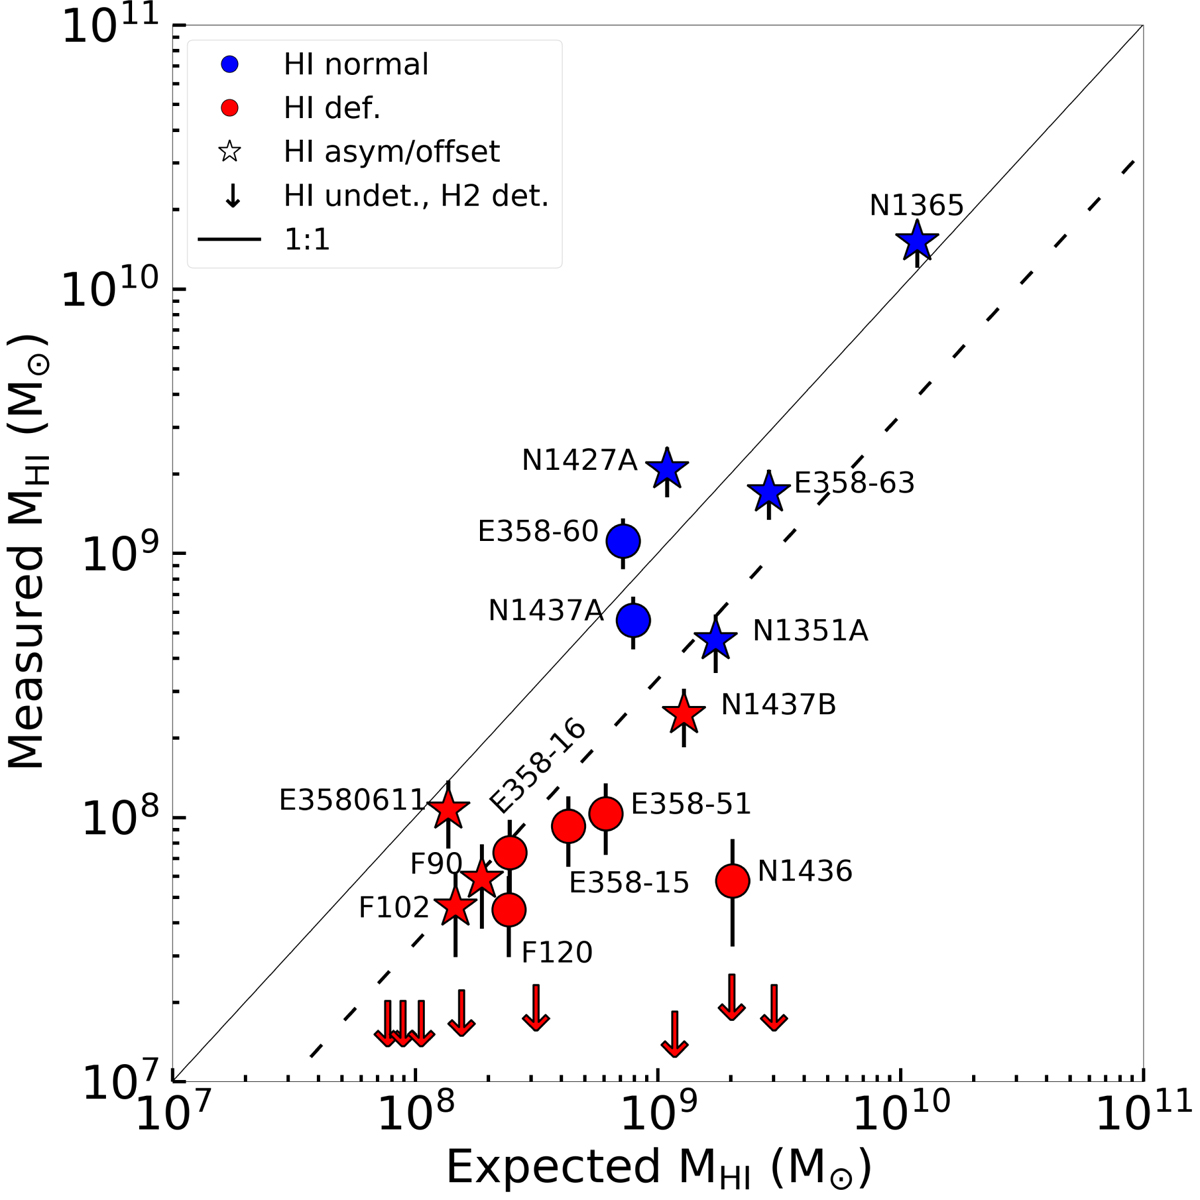
Expected MHI versus measured MHI. The former were evaluated with the Haynes & Giovanelli’s (1984) method with the coefficient summarised by Boselli & Gavazzi (2009). The latter are the ATCA MHI calculated as described in Sect. 3.1. The dashed line, a factor of 3 below the 1:1 relation, shows the typical threshold below which galaxies are considered deficient.
Current usage metrics show cumulative count of Article Views (full-text article views including HTML views, PDF and ePub downloads, according to the available data) and Abstracts Views on Vision4Press platform.
Data correspond to usage on the plateform after 2015. The current usage metrics is available 48-96 hours after online publication and is updated daily on week days.
Initial download of the metrics may take a while.