Fig. 6.
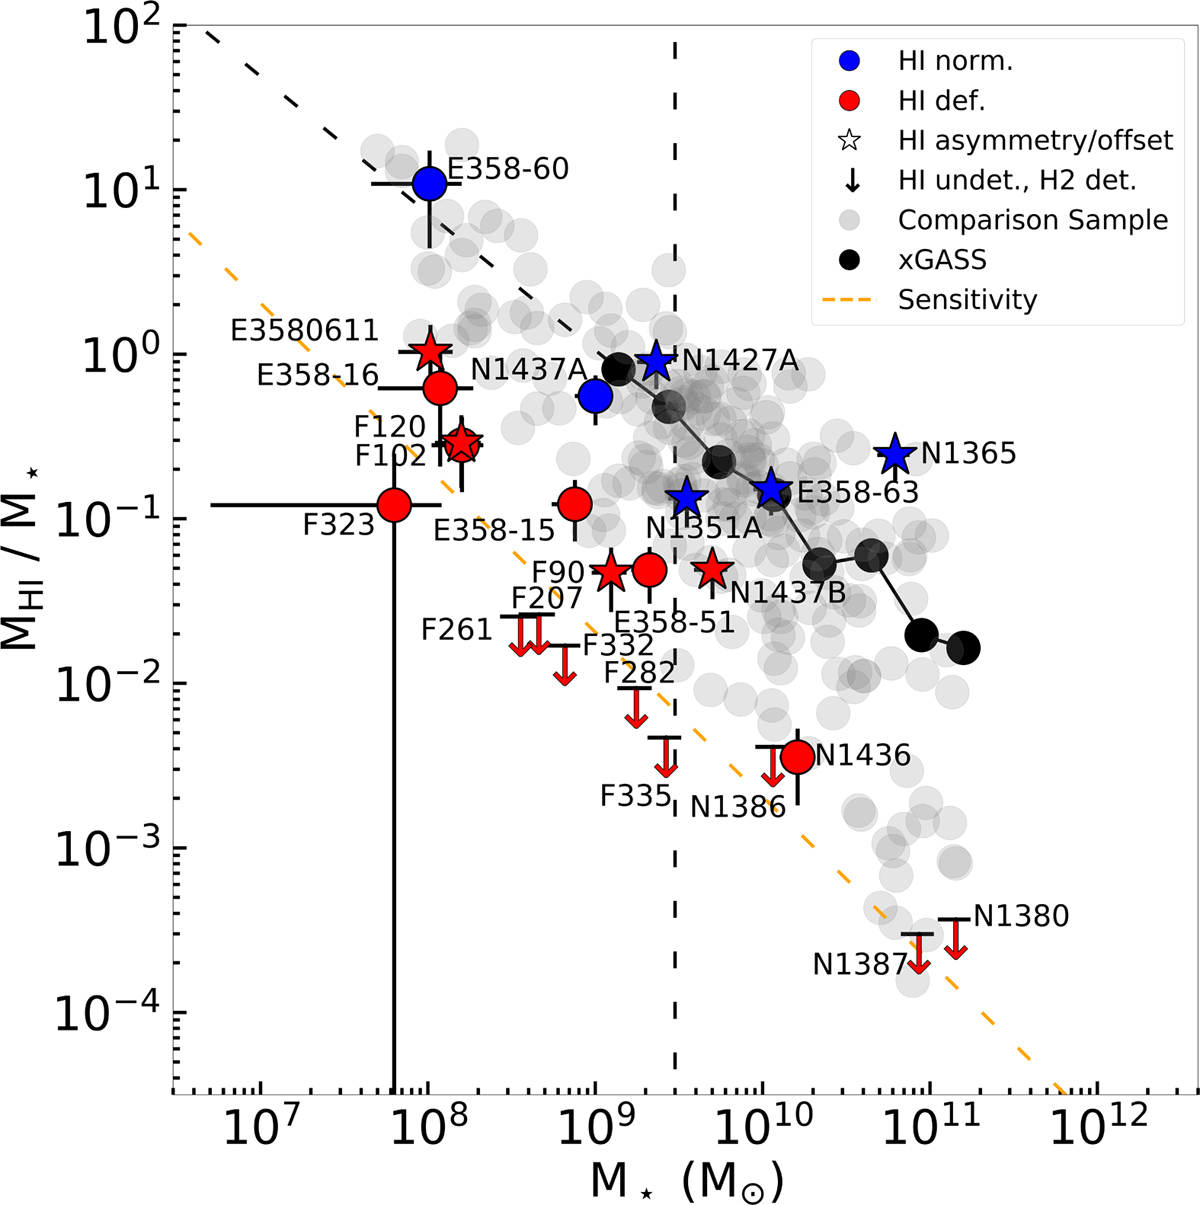
MHI to M⋆ ratio as a function of M⋆. Fornax galaxies (red+blue markers) are compared with non-cluster galaxies from VSG+HRS (grey circles). Red and blue colours show Fornax HI deficient and normal galaxies, respectively. We show Fornax galaxies with a distorted HI morphology with star-shaped markers (see Sect. 3). We show with a black solid line the xGASS scaling relation. The black dashed line is the linear extrapolation of this trend for M⋆ < 1.4 × 10⁹ M⊙. The orange dashed line shows the ATCA average sensitivity evaluated as 3 × 2.8 mJy beam−1 with a linewidth of 100 km s−1. The vertical dashed line at 3 × 10⁹ M⊙ separates low- from high-mass galaxies.
Current usage metrics show cumulative count of Article Views (full-text article views including HTML views, PDF and ePub downloads, according to the available data) and Abstracts Views on Vision4Press platform.
Data correspond to usage on the plateform after 2015. The current usage metrics is available 48-96 hours after online publication and is updated daily on week days.
Initial download of the metrics may take a while.