Fig. 3.
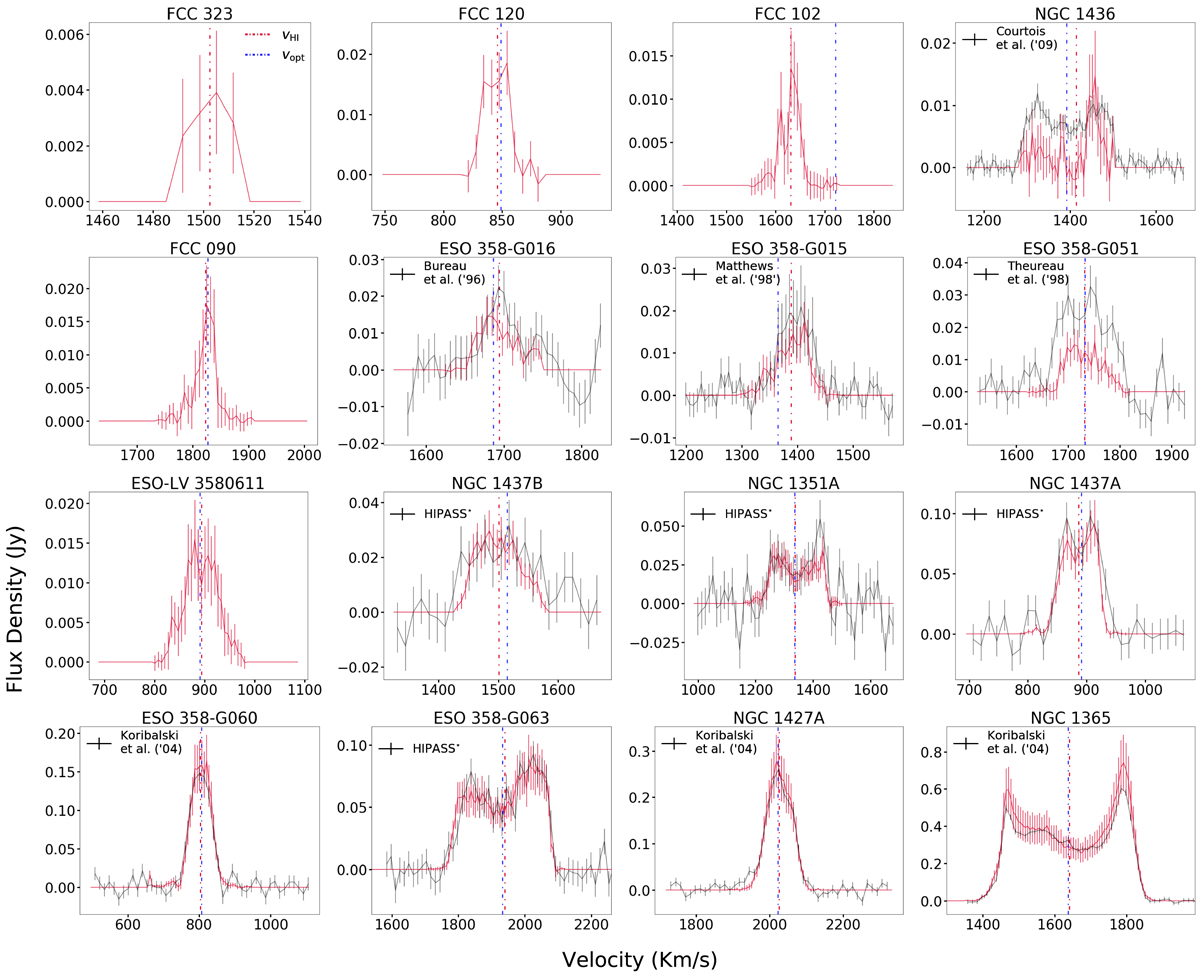
Integrated HI spectra of our Fornax HI detections (in red) sorted according to increasing HI mass as in Fig. 2. We compare our spectra to spectra from the literature (shown in black; see top-left corner for details). We also show the barycentric velocity obtained from our HI spectra (vertical red line) and from optical spectra (vertical blue line; Maddox et al. 2019).
Current usage metrics show cumulative count of Article Views (full-text article views including HTML views, PDF and ePub downloads, according to the available data) and Abstracts Views on Vision4Press platform.
Data correspond to usage on the plateform after 2015. The current usage metrics is available 48-96 hours after online publication and is updated daily on week days.
Initial download of the metrics may take a while.