Fig. 2.
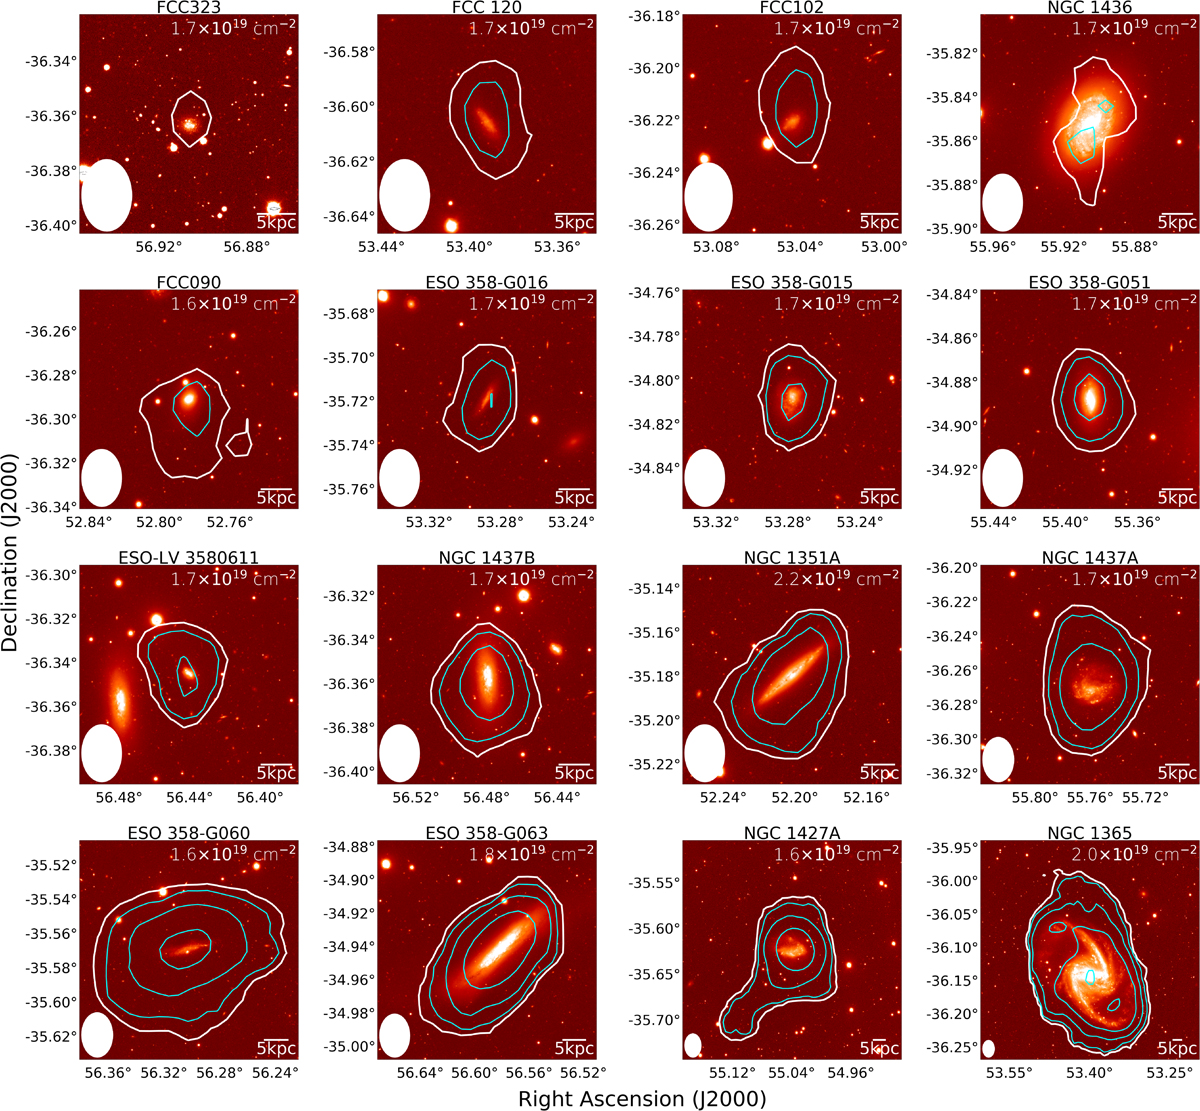
ATCA HI contours overlaid on an optical image for all our HI detections, sorted according to increasing HI mass. The g-band optical images come from the Fornax Deep Survey (Iodice et al. 2016; Venhola et al. 2018; Peletier et al. 2020) for all galaxies except FCC 323, whose g-band optical image comes from the DESI Legacy Imaging Surveys, DR8 release (Dey et al. 2019). In each panel we show the 3σ column density sensitivity – values reported in the top right corner – with white colour, while cyan contours represent steps of 3n from it (n = 0, 1, 2, …). We show the PSF on the bottom-left corner of each panel, and a 5 kpc scale bar in the bottom-right corner.
Current usage metrics show cumulative count of Article Views (full-text article views including HTML views, PDF and ePub downloads, according to the available data) and Abstracts Views on Vision4Press platform.
Data correspond to usage on the plateform after 2015. The current usage metrics is available 48-96 hours after online publication and is updated daily on week days.
Initial download of the metrics may take a while.