Fig. B.1.
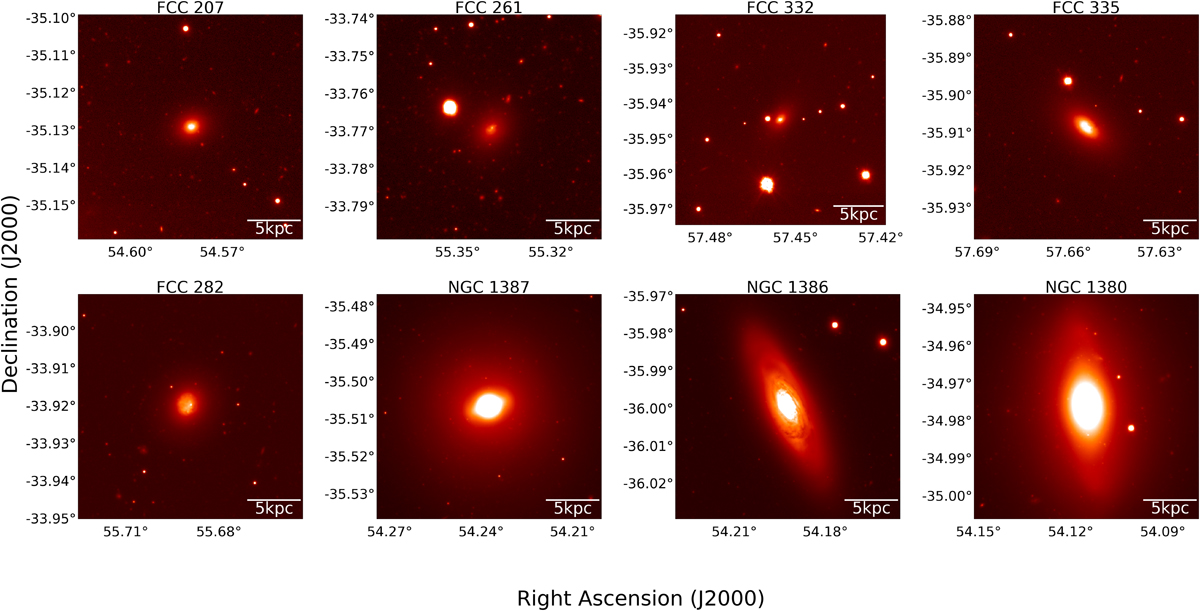
Optical images of the eight H2-rich HI-undetected galaxies (Zabel et al. 2019) for which we evaluated the MH2/MHI ratio (Fig. 9). They are sorted according to increasing MHI upper limit. The g-band optical images come from the Fornax Deep Survey (Iodice et al. 2016; Venhola et al. 2018; Peletier et al. 2020). We show a 5 kpc scale bar in the bottom-right corner.
Current usage metrics show cumulative count of Article Views (full-text article views including HTML views, PDF and ePub downloads, according to the available data) and Abstracts Views on Vision4Press platform.
Data correspond to usage on the plateform after 2015. The current usage metrics is available 48-96 hours after online publication and is updated daily on week days.
Initial download of the metrics may take a while.