Fig. 13.
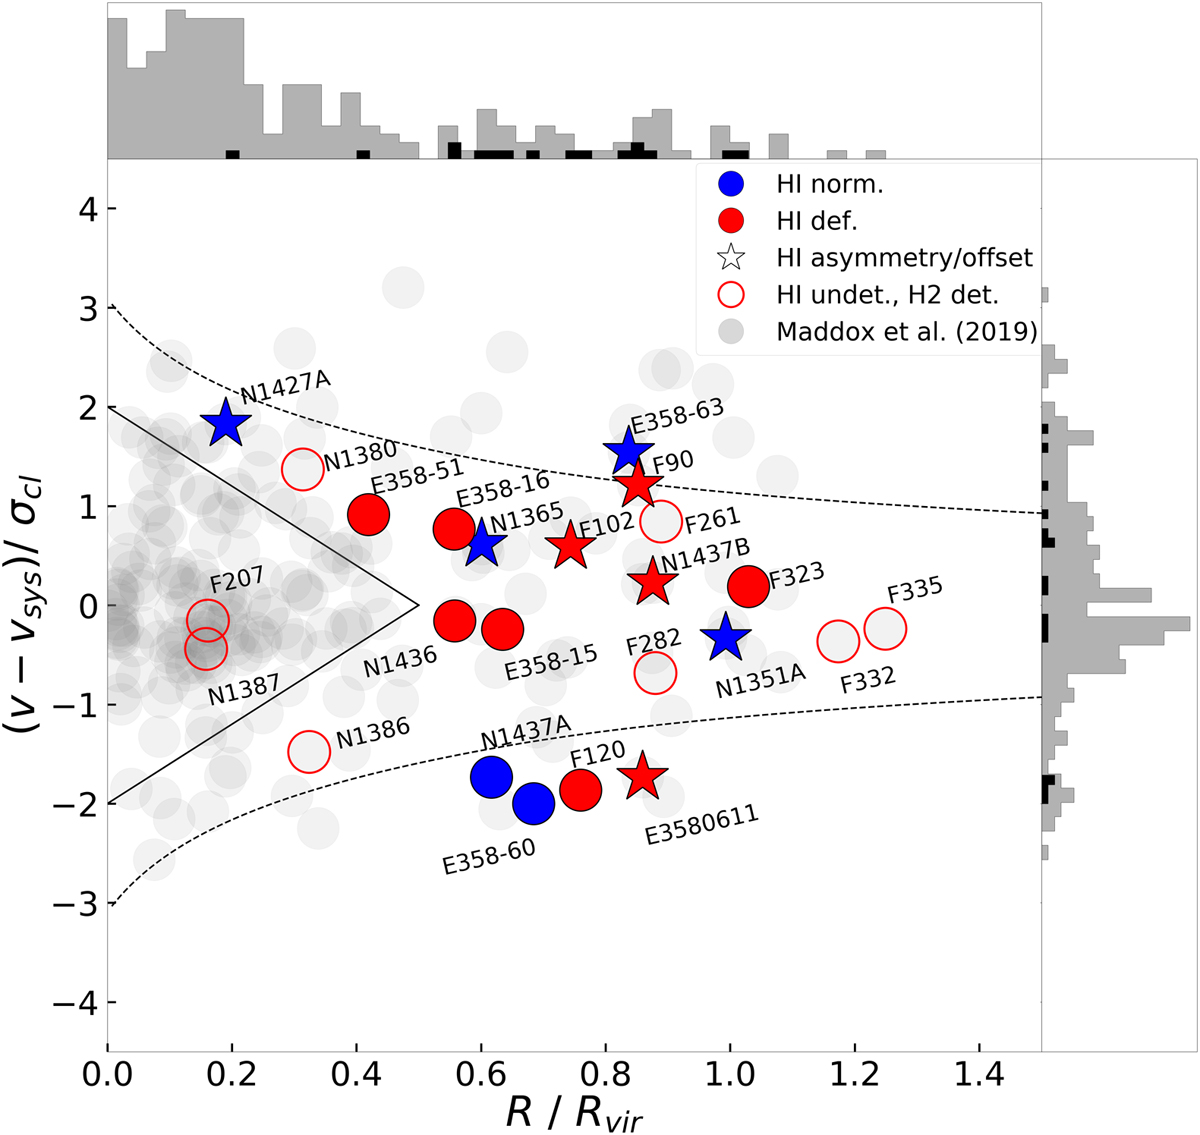
Phase space diagram of the Fornax cluster. Here, we used the same colour coding as Fig. 12. We show the caustic curves of the cluster with black dashed lines. Histograms: black and gray colours represent HI detected galaxies and all Fornax members, respectively. The area within the black triangle shows the virialised area of the cluster.
Current usage metrics show cumulative count of Article Views (full-text article views including HTML views, PDF and ePub downloads, according to the available data) and Abstracts Views on Vision4Press platform.
Data correspond to usage on the plateform after 2015. The current usage metrics is available 48-96 hours after online publication and is updated daily on week days.
Initial download of the metrics may take a while.